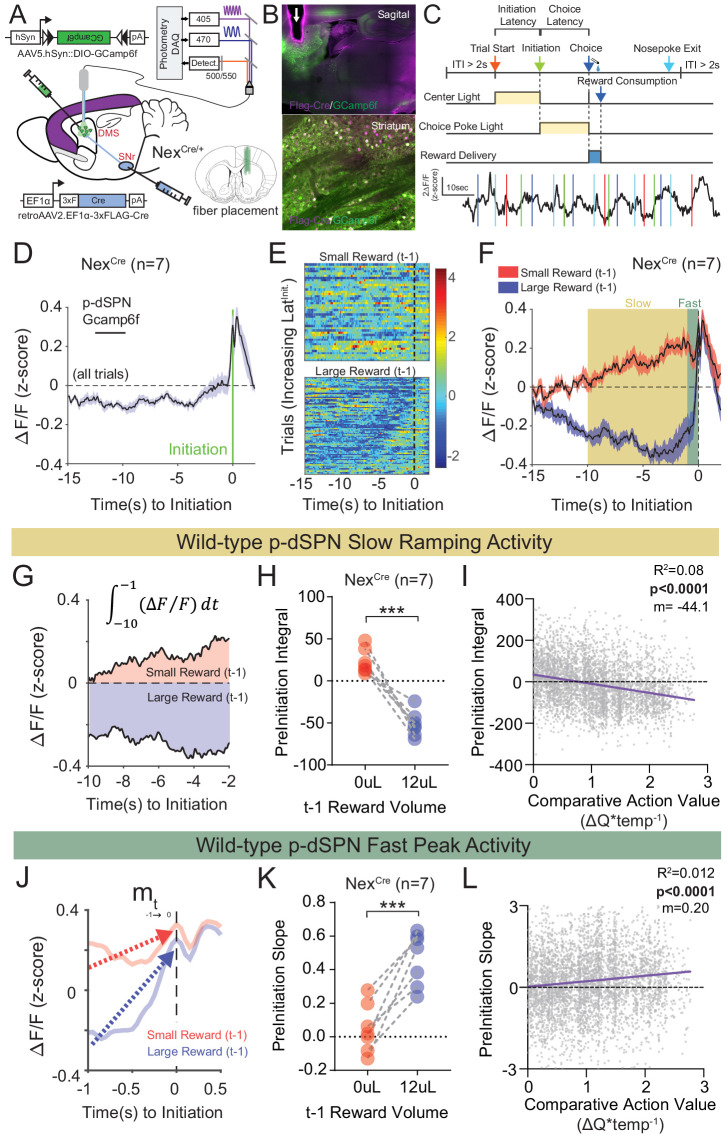
Figure 7. Quantifying value correlates in putative direct pathway SPNs of the dorsomedial striatum.
(A) Schematic of experimental scheme. Control (Nrxn1α+/+; NexCre/+, n = 7) mice were injected with a retro-AAV2-EF1α−3xFLAG-Cre virus in the substantia nigra, pars reticulata (SNr). Ipsilateral injection of Cre-dependent GCamp6f allowed for enrichment of putative direct pathway SPNs (p-dSPNs). (B, top) Sagittal section of NexCre brain showing GCamp6f expression in dorsal striatal SPNs and placement of 400 µm optic fiber (white arrow). (B, bottom) Magnified view of striatum showing colocalization of nuclear FLAG-Cre and cytoplasmic GCamp6f. (B, bottom left) Location of fiber placements in NexCre/+. (C, top) Trial schematic and relationship of specific task epochs with p-dSPN Ca2+ signal (bottom). (D) Peristimulus time histogram (PSTH) of ΔF/F for NexCre/+ aligned to initiation event (all trials). The initiation of the action sequence (green bar) is associated with a rise in p-dSPNs activity. (E) Representative heat map of individual animal trials segregated by reward outcome on (t−1) trial (sorted by the latency to initiate). Trials following a large reward have greater signal suppression than those following small reward. (F) PSTH of ΔF/F for NexCre/+ aligned to initiation event (segregated by outcome on (t−1)). Preinitiation of p-dSPN dynamics exhibits two components – a slow ramping phase (yellow, time-10→-1) followed by a fast spike phase (green, time-1→init), both of which are modulated by (t−1) reward outcome. (G) The slow ramping phase is quantified by the integral of GCamp signal −10 s to −1 s before initiation. (H) There is a significant effect of (t−1) reward volume on the preinitiation integral during slow ramping with large rewards showing greater silencing of p-dSPN activity (paired t-test, ***p=0.0002). (I) Preinitiation integral inversely correlates with the comparative action value of the upcoming trial, which is calculated using probability estimates from fitted reinforcement learning models and reflects the disparity in choice value on a trial to trial basis. (J) The dynamics of the fast peak phase are represented by the average slope of GCamp signal from −1 s till initiation. (K) There is a significant effect of (t−1) reward volume on preinitiation slope during the fast peak phase (paired t-test,***p=0.0006) with large rewards showing steeper subsequent preinitiation slopes. (L) Preinitiation slope positively correlates with the comparative action value of the upcoming trial.


