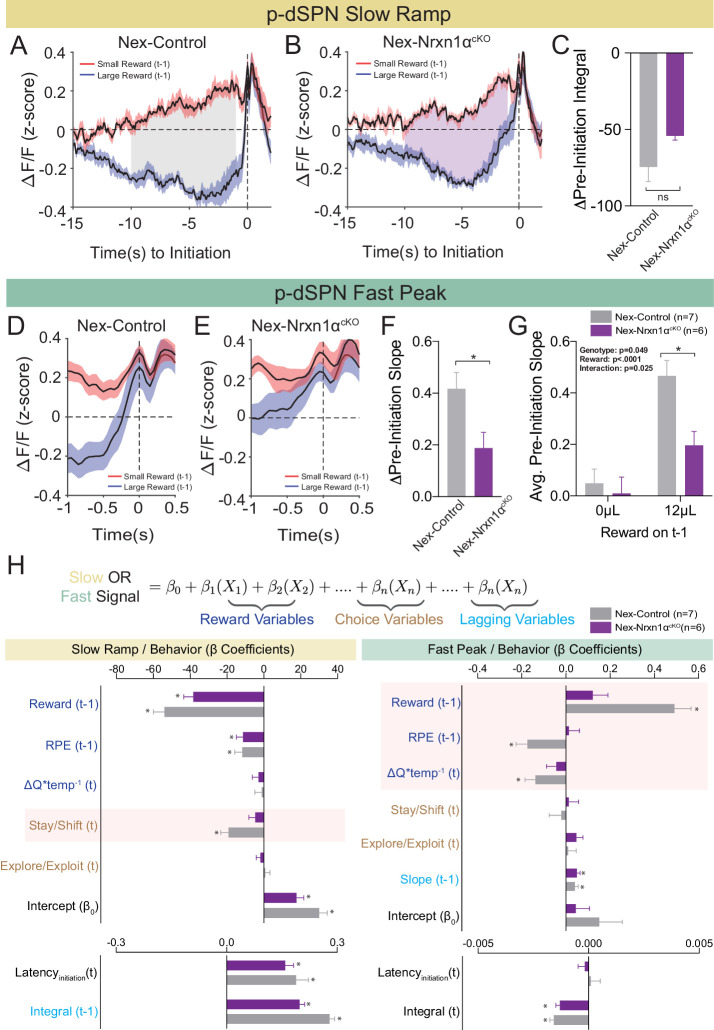
Figure 8. Restricted telencephalic excitatory neuron deletion of Neurexin1α produces a deficit in fast peak activity in p-dSPNs of the DMS.
(A and B) PSTH of ΔF/F for Nex-control (Nrxn1α+/+; NexCre/+, n = 7, gray) and Nex-Nrxn1αcKO (Nrxn1αfl/fl; NexCre/+, n = 6, purple) mice, respectively, aligned to initiation event (segregated by outcome on t−1). Shaded region corresponds to the difference in the preinitiation integral following large and small reward outcomes. (C) There is no statistically significant difference between Nex-control and Nex-Nrxn1αcKO in the Δpre-initiation integral of large versus small rewards (two-sample t-test, n.s., p=0.084). (D and E) PSTH of ΔF/F for control and mutant animals, respectively, in the fast peak phase of preinitiation activity. (F) Nex-Nrxn1αcKO exhibit smaller disparity in fast peak signals after unique reward outcomes, as evidenced by significant effect of genotype on Δpre-initiation slope of the fast peak (two-sample t-test, *p=0.025). (G) This difference in Δpre-initiation slope arises from a blunted GCamp response in mutants to large reward outcomes (two-way RM ANOVA). (H) Modeling Ca2+ signal dynamics as function of reward variables (blue), prior/future choice (gold), and lagging regressors (light blue) to capture prior circuit states. Value modulation of fast peak activity is blunted in Nex-Nrxn1αcKO mice (highlighted red box), while other components of the signal remain intact. Slow ramping is largely intact in mutant animals. All data represented as mean ± SEM.


