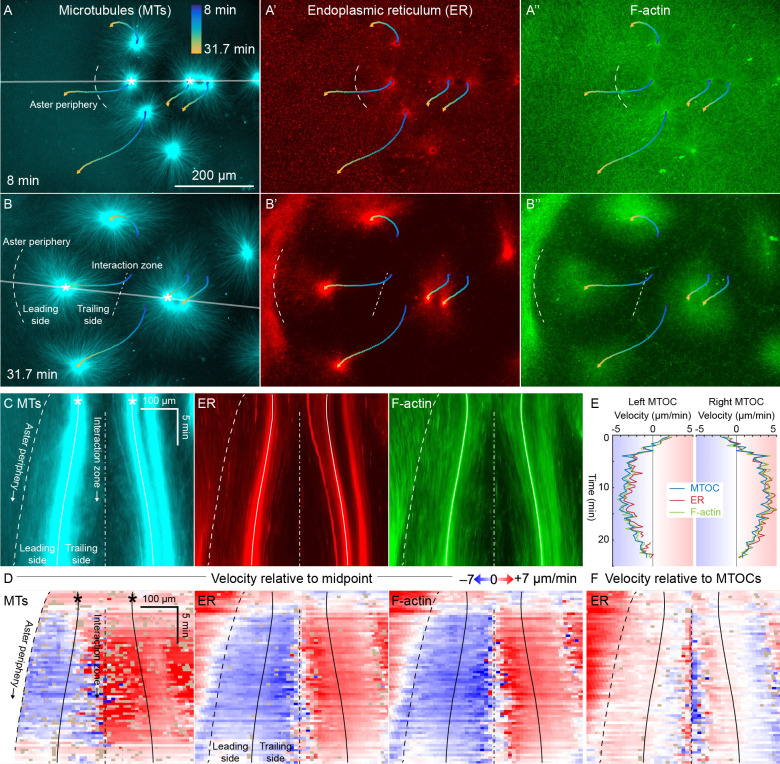
Figure 3. ER and F-actin move with MTs in separating asters.
(A,B) Asters grew until they reached their neighbors, formed interaction zones approximately equidistant between the MTOCs, then moved away from the interaction zones (see Video 2). MTOC trajectories are represented by contours colored from blue to yellow. Time is defined with respect to perfusing the sample and warming to 20°C, so the start of aster growth occurred soon after 0 min. (C) Intensity kymographs along the gray line shown in panels A and B, passing through the MTOCs marked with a white star. To show relative movement of the MTOCs, each row of the kymograph was computationally translated to keep stationary the midpoint between the MTOCs, where the interaction zone formed. Solid curves indicate the MTOCs, the dashed curve indicates the growing aster periphery, and the dash-dotted line indicates the interaction zone. (D) Velocity maps in the same frame of reference as in panel C. 2D flow fields were measured by particle image velocimetry (PIV), projected onto the line passing through the MTOCs, then the projected velocity of the midpoint between the MTOCs was subtracted, again to show movement relative to the interaction zone. A white color indicates stationary with respect to the midpoint, blue indicates moving to the left, and red to the right. PIV outliers were filtered and shown in beige. (E) Velocity of the MTOCs based on particle tracking, as well as the velocity of ER and F-actin in the neighborhood of the MTOCs based on PIV. (F) Velocity of ER with respect to the moving MTOCs, not with respect to the interaction zone as in panel D.


