. 2020 Dec 10;9:e60821. doi: 10.7554/eLife.60821

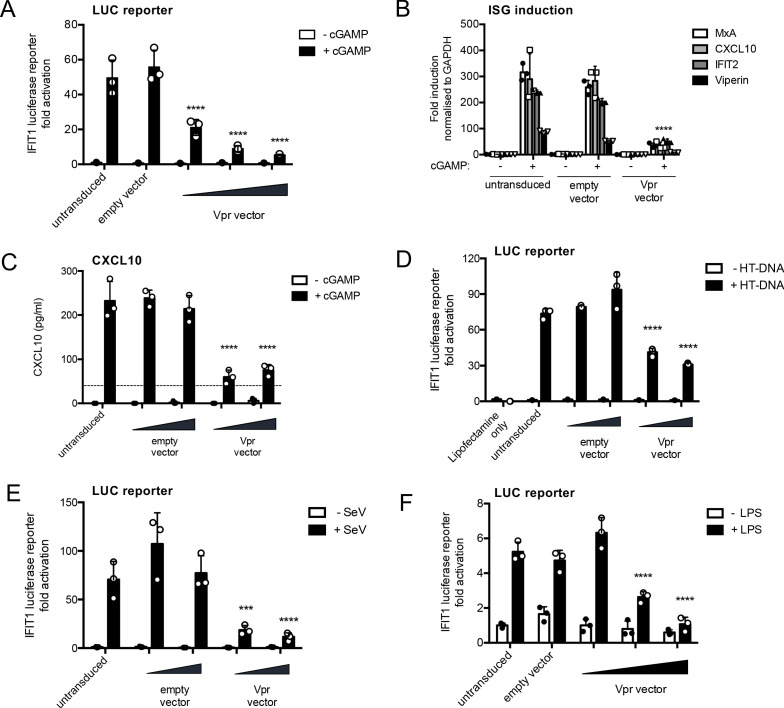
Figure 2. HIV-1 Vpr expression inhibits interferon-stimulated gene expression after stimulation with various innate immune stimuli.

(A) Fold induction of IFIT1-Luc, after activation of STING by cGAMP (5 μg/ml), in IFIT1-Luc reporter THP-1 cells expressing Vpr from a lentiviral vector delivered at MOIs of 0.25, 0.5, 1, or after empty vector transduction (MOI 1) or in untransduced cells. (B) Fold induction of ISGs MxA, CXCL10, IFIT2, and Viperin after activation of STING by cGAMP (5 μg/ml) in cells expressing Vpr from a lentiviral vector (MOI 1), or after empty vector transduction (MOI 1) or in untransduced THP-1 cells. (C) Secreted CXCL10 (ELISA) after activation of STING by cGAMP (5 μg/ml) in cells expressing Vpr from a lentiviral vector (MOI 0.5, 1), or after transduction with empty vector (MOI 0.5, 1) or in untransduced THP-1 cells. Dotted line shows limit of detection. (D) Fold induction of IFIT1-Luc after HT-DNA transfection (5 μg/ml) of cells expressing Vpr from a lentiviral vector (MOI 0.5, 1), or empty vector (MOI 0.5, 1) or in untransduced IFIT1-Luc reporter THP-1 cells. (E) Fold induction of IFIT1-Luc, after Sendai virus infection, of cells expressing Vpr from a lentiviral vector (MOI 0.5, 1), or after transduction by empty vector (MOI 0.5, 1) or in untransduced IFIT1-Luc reporter THP-1 cells. (F) Fold induction of IFIT1-Luc, after LPS treatment (1 μg/ml), of cells expressing Vpr from a lentiviral vector (MOI 0.25, 0.5, 1), after transduction by empty vector (MOI 1) or in untransduced IFIT1-Luc reporter THP-1 cells. Data are expressed as mean ± SD (n = 3) analyzed using two-way ANOVA * (p<0.05), ** (p<0.01), *** (p<0.001), **** (p<0.0001) compared to data for empty vector. n = 3 (A, D–F) or 2 (B–C) independent experiments.

Figure 2.

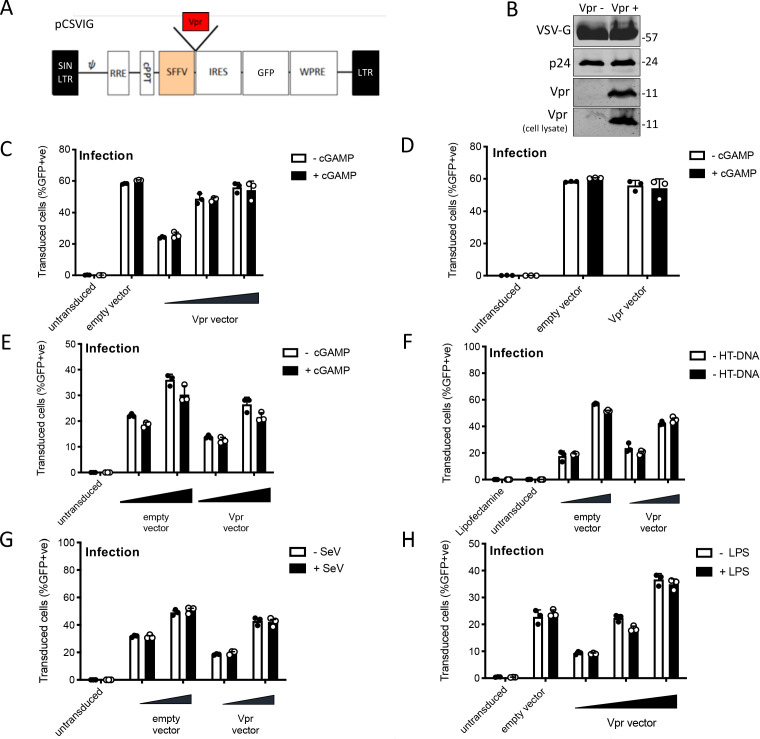
Figure 2—figure supplement 1. HIV-1 Vpr expression inhibits interferon-stimulated gene expression after stimulation with various innate immune stimuli.

Figure 2—figure supplement 1.

(A) Vpr-encoding lentiviral expression construct (pCSVIG) contained self-inactivating long-terminal repeat (SIN LTR), Rev response element (RRE), central polypurine tract (cPPT), spleen focus-forming virus promoter (SFFV), internal ribosome entry site (IRES), green fluorescent protein (GFP), and Woodchuck hepatitis virus post‐transcriptional regulatory element (WPRE). (B) Immunoblot detecting VSV-G envelope, capsid (p24) and Vpr in vector supernatant and Vpr additionally in target cell lysate. Size markers in kDa are indicated on the right. (C) Percentage of THP-1 cells in Figure 2A transduced by the vector encoding Vpr and GFP (MOI 0.25, 0.5, 1) or empty vector encoding GFP alone (MOI 1) and treated with cGAMP (5 μg/ml) or left untreated as a control. (D) Percentage of THP-1 cells in Figure 2B transduced by the vector encoding Vpr and GFP (MOI 1) or empty vector encoding GFP alone (MOI 1) and treated with cGAMP (5 μg/ml) or left untreated as a control. (E) Percentage of THP-1 cells in Figure 2C transduced by the vector encoding Vpr and GFP (MOI 0.5, 1) or empty vector expressing GFP alone (MOI 0.5, 1) and treated with cGAMP (5 μg/ml) or left untreated as a control. (F) Percentage of THP-1 cells in Figure 2D transduced by the vector encoding Vpr and GFP (MOI 0.5, 1) or empty vector encoding GFP alone (MOI 0.5, 1) and stimulated with HT-DNA transfection (5 μg/ml) or left untreated as a control. (G) Percentage of THP-1 cells in Figure 2E transduced by the vector encoding Vpr and GFP (MOI 0.5, 1) or empty vector expressing GFP alone (MOI 0.5, 1) and stimulated with Sendai virus infection or left untreated as a control. (H) Percentage of THP-1 cells in Figure 2F transduced by the vector encoding Vpr and GFP (MOI 0.25, 0.5, 1) or empty vector encoding GFP alone (MOI 1) and stimulated with LPS treatment (1 μg/ml) or left untreated as a control. Data are expressed as means ± SD (n = 3). Data are representative of three (C, F–H) or two (B, D, E) independent experiments.