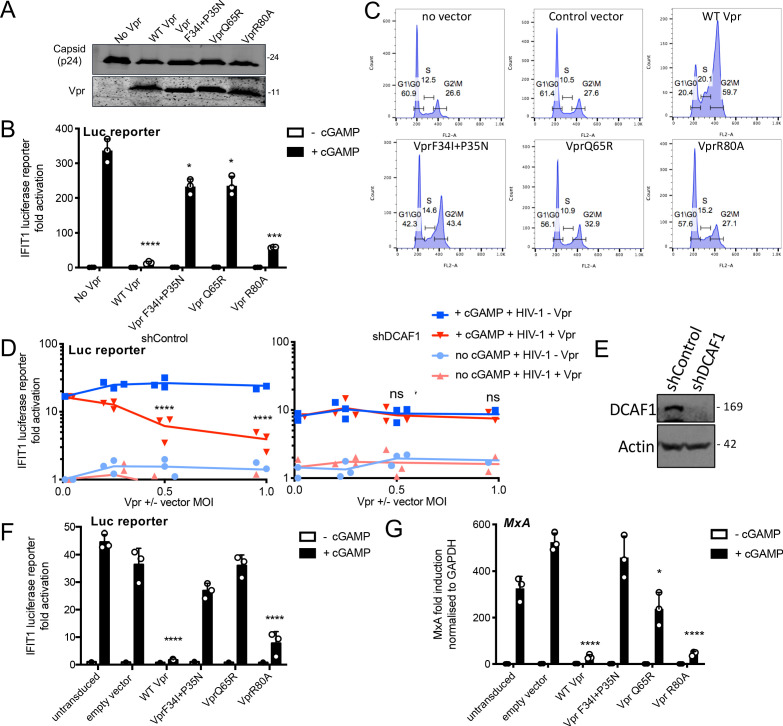
Figure 3. Vpr inhibition of innate immune activation is dependent on DCAF1 but independent of cell cycle arrest.
(A) Immunoblot detecting p24 (capsid) and Vpr in pelleted VSV-G pseudotyped VLP lacking genome used in (B). Size markers in kDa are indicated on the right. (B) Fold induction of IFIT1-Luc after activation of STING by cGAMP (5 μg/ml) and infection with VLP bearing WT or mutant Vpr, or lacking Vpr (1 RT U/ml) in IFIT1-Luc reporter THP-1 cells. Cells were infected at the same time as cGAMP treatment. (C) Flow cytometry plots showing cell cycle phases of THP-1 cells transduced with an empty vector, WT Vpr, or mutant Vpr, encoding vector (MOI 1) or left untransduced as a control and stained with propidium iodide to label DNA. Percentage cells in each cell cycle stage are shown. (D) Fold induction of IFIT1-Luc after activation of STING by cGAMP (5 μg/ml) in cells expressing Vpr from a lentiviral vector, or expressing empty vector, or in untransduced IFIT1-Luc reporter THP-1 cells expressing a control, or a DCAF1 targeting shRNA. Mean +/- SEM n = 3 independent experiments. (E) Immunoblot detecting DCAF1, or actin as a loading control, from extracted THP-1 cells expressing a non-targeting, or DCAF1-targeting, shRNA. Size markers are shown in kDa on the right. (F) Fold induction of IFIT1-Luc after activation of STING by cGAMP (5 μg/ml) in cells expressing WT, or mutant, Vpr from a lentiviral vector (MOI 1), or empty vector (MOI 1) or in untransduced IFIT1-Luc reporter THP-1 cells. (G) Fold induction of MxA mRNA after activation of STING by cGAMP (5 μg/ml) in cells expressing WT, or mutant, Vpr from a lentiviral vector (MOI 1), or after transduction by empty vector (MOI 1) or in untransduced THP-1 cells. Data are mean ± SD (n = 3). Two-way ANOVA test: * (p<0.05), ** (p<0.01), *** (p<0.001), **** (p<0.0001) compared to no Vpr or empty vector controls. Data are representative of three (B–D, F) or two (A, E, G) independent experiments.


