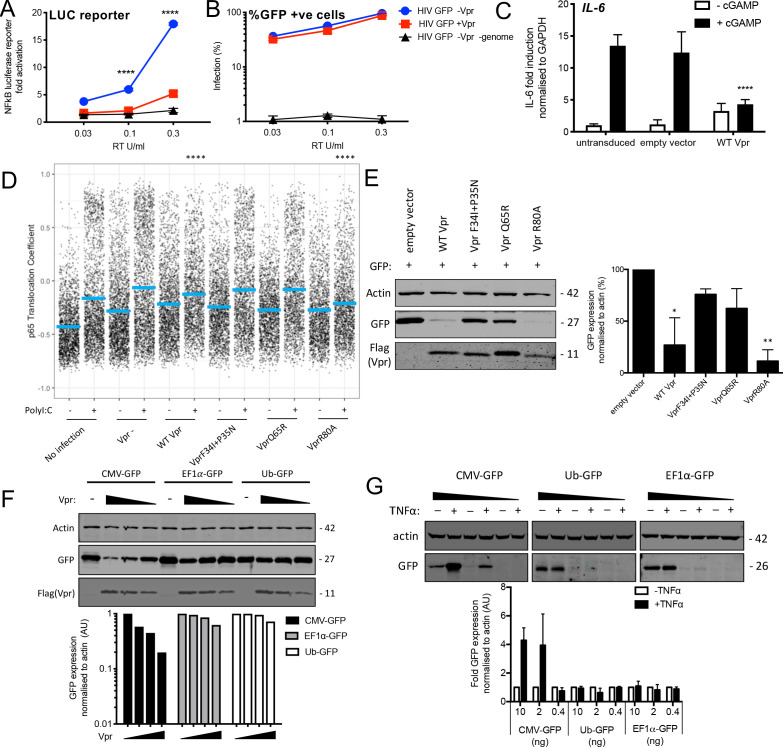
Figure 6. Vpr inhibits NF-κB p65 nuclear translocation and NF-κB-sensitive plasmid expression.
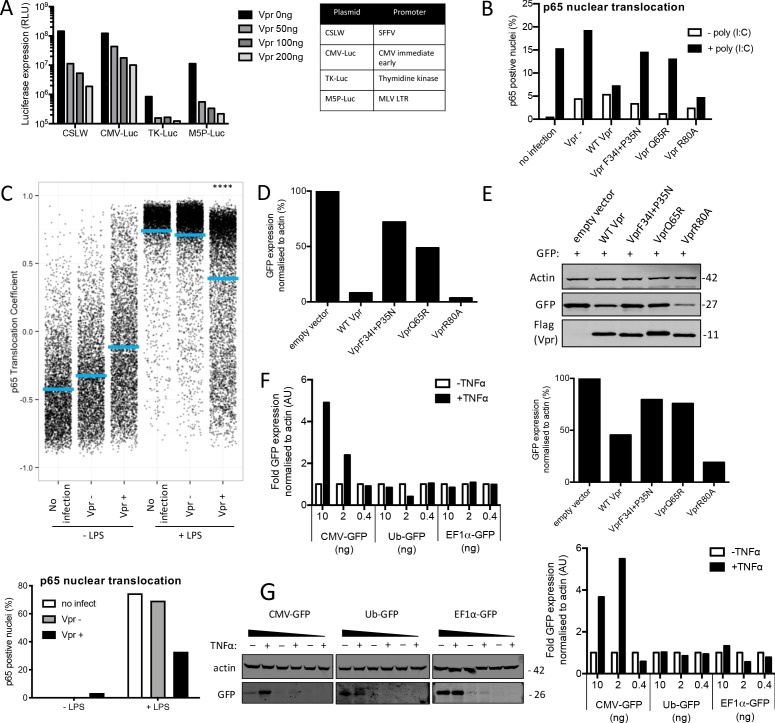
(A) Fold induction of NF-κB-Luc after infection of THP-1 cells with HIV-GFP lacking Vpr, HIV-GFP bearing Vpr, or HIV-GFP lacking Vpr and genome, at the indicated doses. (B) Percentage of THP-1 cells in (A). (C) Fold induction of IL-6 after activation of STING by cGAMP (5 μg/ml) in cells expressing empty vector or Vpr encoding vector (MOI 1), or in untransduced THP-1 cells. (D) Single-cell immunofluorescence measurement of NF-κB (p65) nuclear translocation in PMA differentiated THP-1 cells transfected with Poly I:C (50 ng/ml), or left untreated, and infected with HIV-1 GFP lacking Vpr, HIV-1 GFP bearing Vpr (1 RT U/ml) or left uninfected. Cells were stained 3 hr after transfection and infection. (E) Immunoblot detecting Flag-Vpr, GFP, or actin as a loading control, from HEK293T cells transfected with 50 ng of empty vector, Flag-tagged WT Vpr vector, or Flag-tagged mutant Vpr vector, and CMV-GFP vector (50 ng). Size markers are shown in kDa. GFP expression from two independent immunoblots was quantified by densitometry and is shown in the lower panel. (F) Immunoblot detecting Flag-Vpr, GFP, or actin as a loading control, from HEK293T cells transfected with empty vector (200 ng) or Vpr vector (50 ng, 100 ng, 200 ng) and CMV-GFP, EF1α-GFP or Ub-GFP plasmids (50 ng). Size markers are shown in kDa. GFP expression quantified by densitometry is shown in the lower panel. (G) Immunoblot detecting GFP, or actin as a loading control, from HEK293T cells transfected with CMV-GFP, EF1α-GFP or Ub-GFP plasmids (10 ng, 2 ng, 0.4 ng) and stimulated with TNFα (200 ng/ml) or left unstimulated. Size markers are shown in kDa. GFP expression, from two independent immunoblots, quantified by densitometry, is shown in the lower panel. Data in (A, B, C) is expressed as mean ± SD (n = 3). Data in (E, F, G) is expressed as mean ± SD (n = 2). Two-way ANOVA: * (p<0.05), ** (p<0.01), *** (p<0.001), **** (p<0.0001) compared to empty vector or HIV GFP+Vpr.


