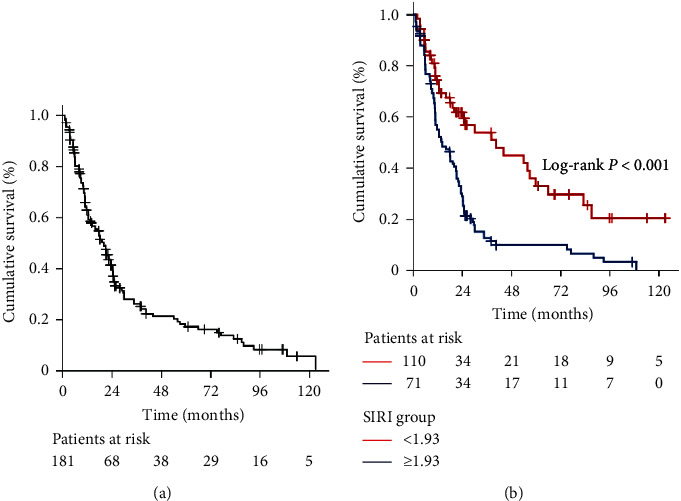
Figure 2.

Overall survival outcomes: (a) whole-study population and (b) per pretreatment SIRI groups (blue line: SIRI < 1.9 and green line: SIRI ≥ 1.9).

Overall survival outcomes: (a) whole-study population and (b) per pretreatment SIRI groups (blue line: SIRI < 1.9 and green line: SIRI ≥ 1.9).