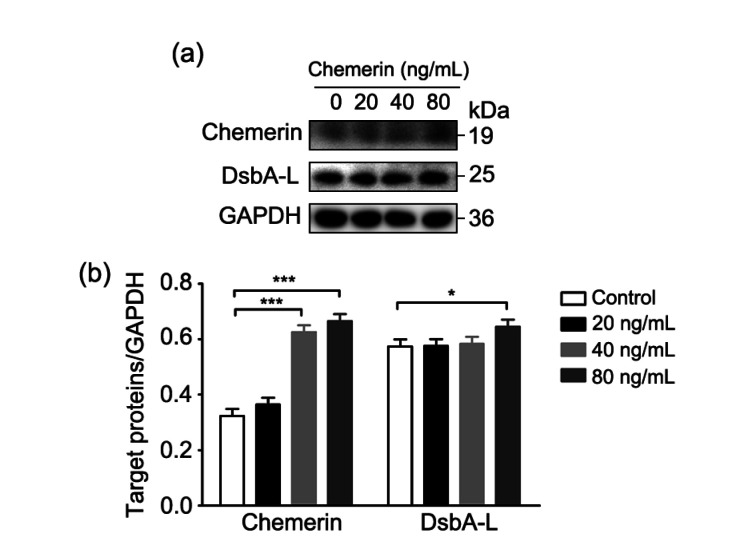
Fig. 2.
Expression of DsbA-L upregulated by chemerin
The chemerin concentration gradient consisted of 20, 40, and 80 ng/mL treatments, as well as a control group without additional chemerin. (a) Representative image of the immunoblots of cell samples (50 μg); (b) Relative quantitative analyses of chemerin and DsbA-L. DsbA-L: disulfide-bond A oxidoreductase-like protein; GAPDH: glyceraldehyde-3-phosphate dehydrogenase. Data are shown as mean±standard deviation (SD) (n=3). * P<0.05, *** P<0.001

