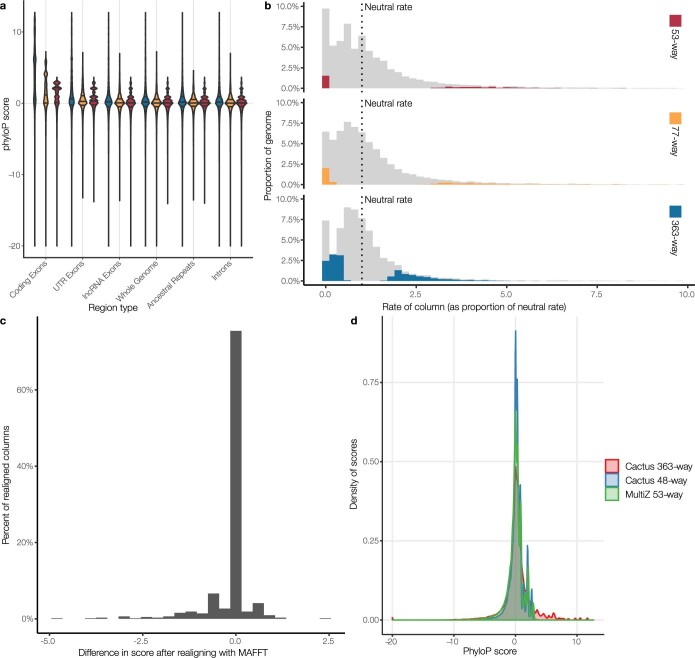
Extended Data Fig. 10. Distribution of acceleration and conservation scores.
a, Distribution of conservation and acceleration scores within different functional region types across alignments. Lines mark quartiles of the density estimates. b, Larger histogram of chicken column rates. This panel is similar to Fig. 3b, but includes accelerated columns ending at a rate of 10× the neutral rate. c, Difference in PhyloP scores (compared to original scores) after realignment with MAFFT for a random sample of significantly conserved sites. d, Comparison of the distribution of PhyloP scores across alignments. Scores indicate log-scaled probabilities of conservation (positive values) or acceleration (negative values) for each base in the genome. a and d show results from three alignments for 53 birds, 77 vertebrates and 363 birds.

