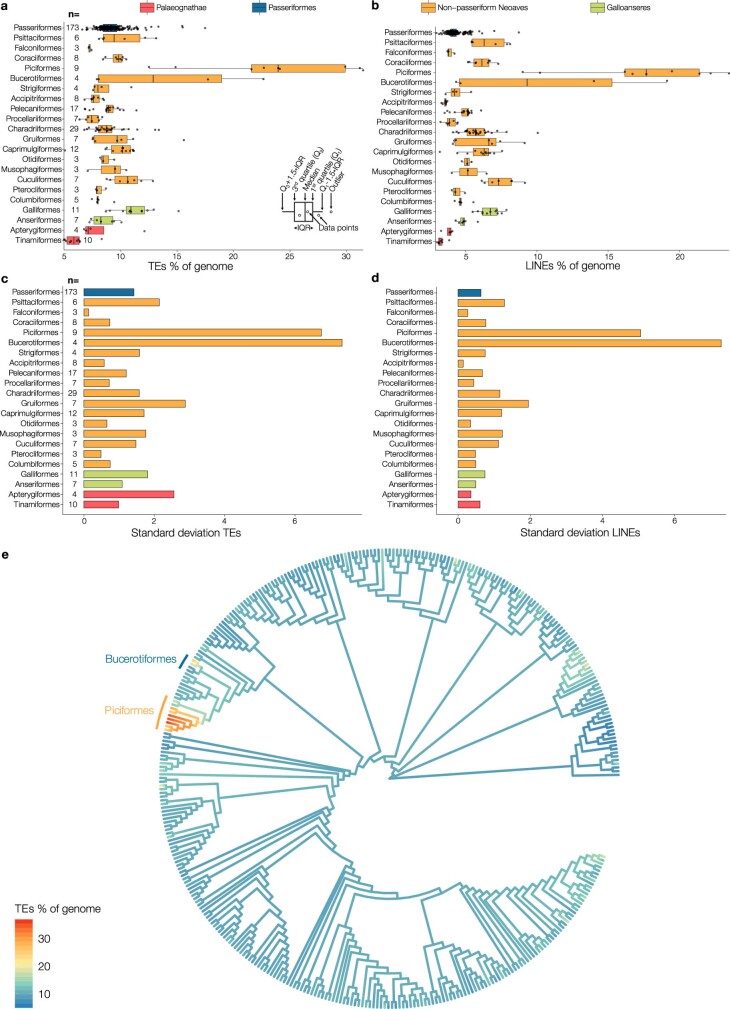
Extended Data Fig. 2. Distribution of transposable elements.
a, Percentage of the genome that is a transposable element (TE). Box plots are shown for groups with at least three sequenced species. b, Per cent base pairs of the genome that are long interspersed nuclear elements (LINEs), grouped by orders. Box plots are shown for groups with at least three sequenced species. c, S.d. of the transposable element content for orders with at least three sequenced species. d, S.d. of the per cent LINE content for orders with at least three sequenced species. e, Ancestral state reconstruction of total transposable elements. The branch colour from blue to red indicates an increase in transposable elements. Two orders with noticeable patterns—Piciformes and Bucerotiformes—are labelled on the tree. A zoomable figure with labels for all terminals is available at www.doi.org/10.17632/fnpwzj37gw.

