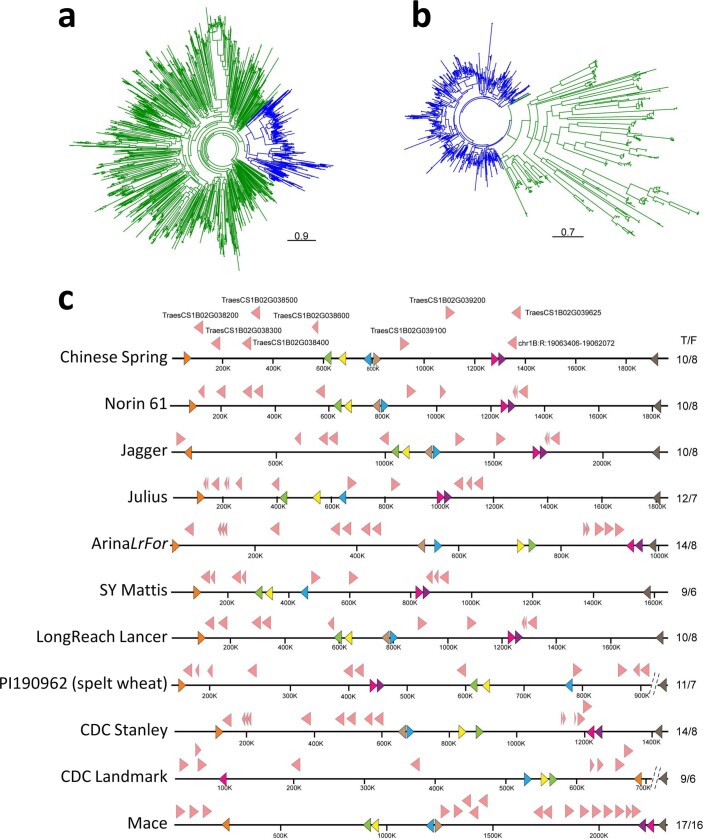
Extended Data Fig. 4. Evolutionary relationships among PPR and mTERF gene sequences.
a, The RFL clade is in blue and all remaining P-class PPRs are in green. b, Clustered mTERF sequences are in blue and the remaining mTERFs are shown in green. The scale bar represents number of substitutions per site. c, Sequence inversions and copy number variation at the Rf3 locus on chromosome 1B. RFL genes are shown as light pink triangles above the chromosome scale. Conserved non-PPR genes used as syntenic anchors are shown on the chromosome scale as coloured triangles. The total number (T) and the number of putatively functional RFL genes with 10 or more PPR motifs (F) are indicated on the right side of each panel.

