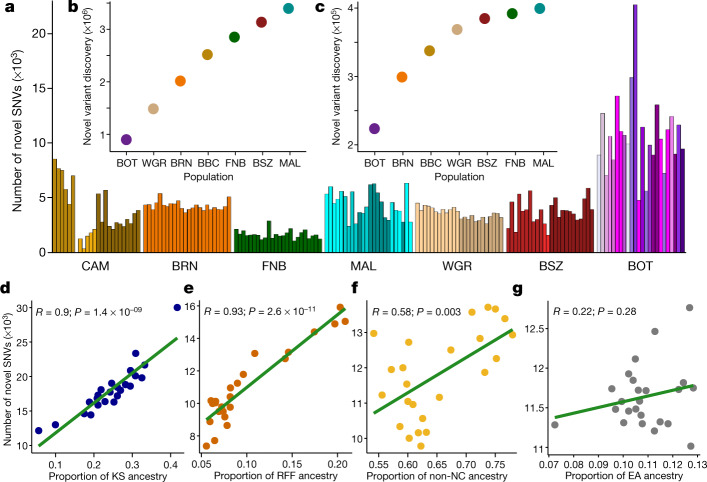
Fig. 3. Novel variation in the H3Africa dataset.
a, Novel variants per individual in each population (n = 24 biological independent samples randomly chosen from each group to match the smallest used dataset). Shading within a population reflects self-identified ethnolinguistic affiliations (Supplementary Table 3). b, c, The number of additional total (b) and common (c) variants discovered in each population starting with those identified in BOT. d–g, Correlation (Pearson, line of best fit is shown in green) between the number of novel SNVs and proportion of KS in BOT (d), RFF in CAM (e), non-NC in MAL (f) and east African (EA) ancestry in BRN (g).

