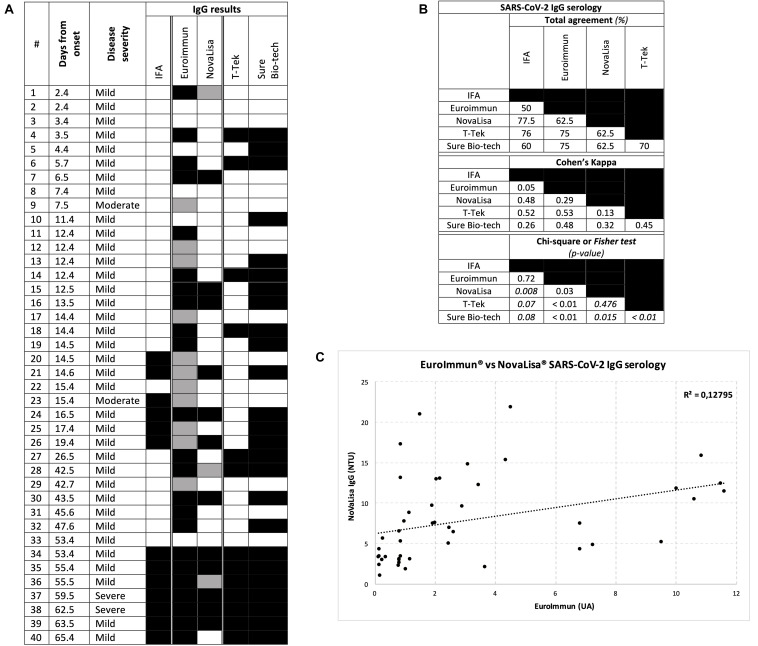
FIGURE 1.
Results for IgG serology. (A) Individual CoVID-19 patient results. Each row represents a patient, each column a serological test, a black block a positive result, a gray block an inconclusive result (for ELISA methods), and a white block a negative result (B) Total agreement, Cohen’s Kappa value and Chi-square (or Fisher’s exact test in italic) p-value between two tests (C) Correlation plot between the two ELISA methods.

