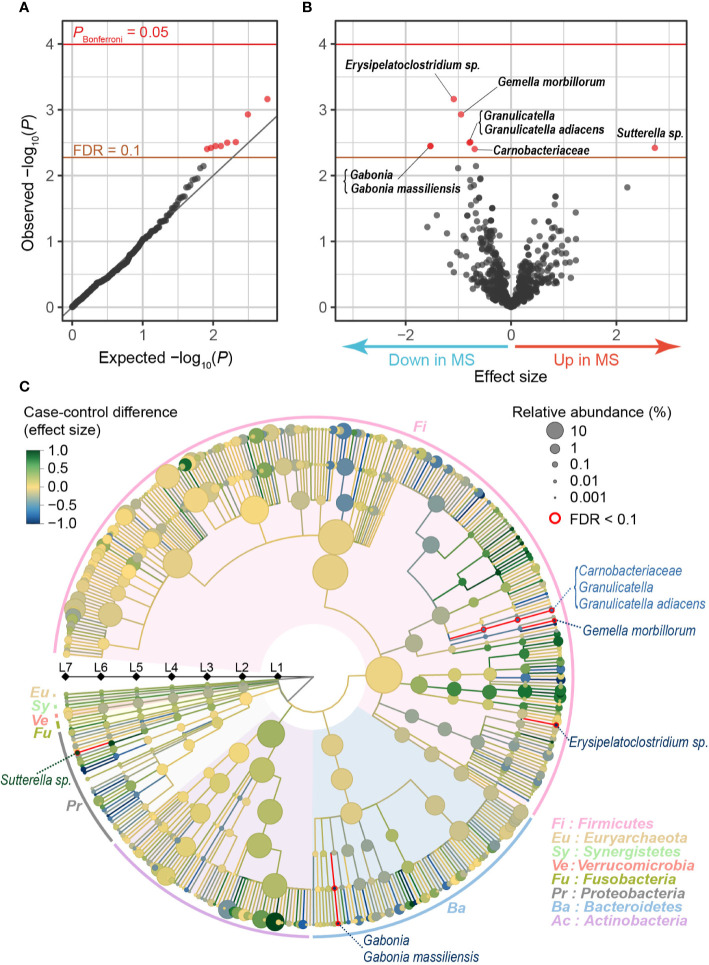
Figure 1.
MWAS results of MS case-control phylogenetic association tests. (A) A quantile-quantile plot of the MWAS P-values of the clades. The x-axis indicates empirically estimated median -log10 P-values. The y-axis indicates observed -log10 P-values. The diagonal gray line represents y = x, which corresponds to the null hypothesis. The horizontal red line indicates the empirical Bonferroni-corrected threshold (α = 0.05), and the brown line indicates the empirically estimated (FDR-q = 0.1). Clades with FDR-q < 0.1 are plotted as red dots, and other clades as black dots. (B) A volcano plot. The x-axis indicates effect sizes of generalized linear model. The y-axis, horizontal lines, and dot colors are the same as in panel (A). (C) Phylogenetic tree. Levels L2–L7 are from the inside layer to the outside layer. The size and color of dots represent relative abundance and effect sizes, respectively. The five clades with suggestive case-control associations (FDR-q < 0.1) are outlined in red. FDR, false discovery rate; MWAS, metagenome-wide association study; MS, multiple sclerosis.

