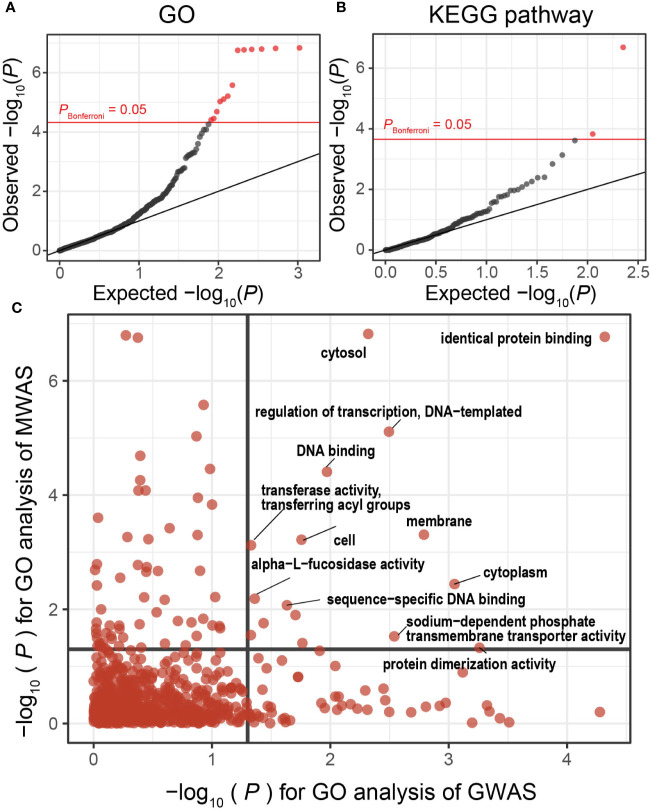
Figure 3.
MWAS results of MS case-control pathway association tests. (A) A quantile-quantile plot of the MWAS P-values of enrichment analyses based on GO terms. GO terms with P-values less than Bonferroni thresholds are plotted as red dots, and the other clades as black dots. (B) A quantile-quantile plot of the MWAS P-values of enrichment analyses based on KEGG pathways. (C) Comparison of P-values of GO enrichment analyses between the MS MWAS and GWAS data. The x-axis indicates the P-values of the GWAS. The y-axis indicates the P-values of the MWAS. The horizontal and vertical black lines indicate P-value of 0.05. The overlap of the GO enrichment was evaluated by classifying the GO terms based on the significance threshold of P < 0.05 or P ≥ 0.05 and using Fisher’s exact test. GO, Gene Ontology; GWAS, genome-wide association study; KEGG, Kyoto Encyclopedia of Genes and Genomes; MWAS, metagenome-wide association study; MS, Multiple sclerosis.

