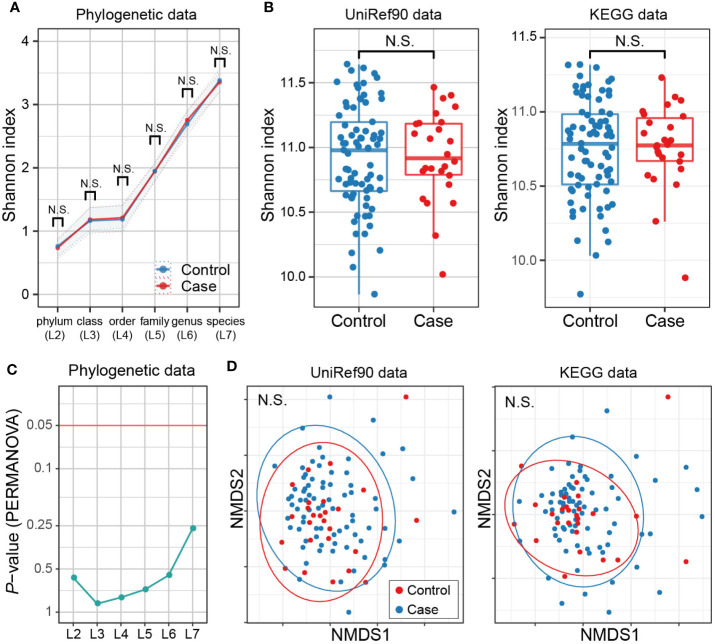
Figure 4.
MS case-control comparison of microbial diversities. (A) Alpha diversities of the phylogenetic relative abundance data for six levels. Welch’s t-test of Shannon index between MS cases and controls showed no significant difference at any level. (B) Alpha diversities of the gene abundance data of the UniRef90 protein and KEGG gene databases. No significant case-control difference was found. (C) Beta diversities of phylogenetic relative abundance data at six levels. PERMANOVA based on Bray-Curtis dissimilarities found no significant differences among levels for either sequencing group with Bonferroni correction. (D) Beta diversities of the gene abundance of the UniRef90 protein database. No significant case-control difference was found. KEGG, Kyoto Encyclopedia of Genes and Genomes; NMDS, non-metric multidimensional scaling; PERMANOVA, permutational multivariate analysis of variance; MS, Multiple sclerosis.

