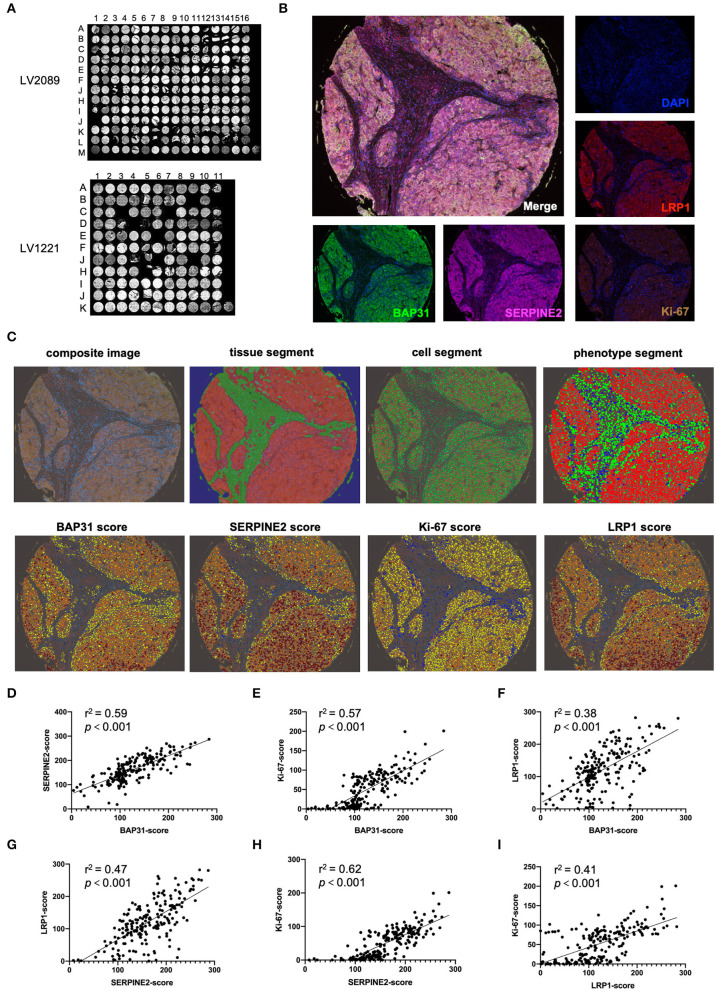
Figure 5.
Multiplex IHC staining indicates that BAP31 is positively correlated with SERPINE2, LRP1, and Ki67. (A) The HCC tissue microarrays LV2089 and LV1221 were stained using Opal 7-plex technology. (B) The merged-channel multispectral image was captured after four-cycle TSA staining and DAPI counterstain and separated by single channels. Fake colors are assigned as DAPI: blue, BAP31: green, SERPINE2: pink, LRP1: red, and Ki-67: brown (A5 point of LV2089 is shown). (C) The typical analysis process of composite image is as follows: first, at the tissue segment stage, the malignant tumor and tumor stroma are distinguished as red and green, respectively; second, at the cell segment stage, the cell nuclei are identified and labeled with green; third, at the phenotype segment stage, the tumor, interstitial, and immune cells are distinguished as red, green, and blue, respectively; finally, at the scoring stage, blue represents no expression, yellow represents 1+, orange represents 2+, and tan represents 3+; each result was assigned a comprehensive H-score. (D–F) The correlation between the expression levels of BAP31 and SERPINE2, Ki-67, and LRP1 in HCC tumor tissue. (G,H) The correlation between the expression levels of SERPINE2 and Ki-67 and LRP1. (I) The correlation between the expression levels of LRP1 and Ki-67. BAP31, B-cell receptor-associated protein 31; HCC, hepatocellular carcinoma; IHC, immunohistochemistry; SERPINE2, serpin family E member 2; TSA, tyramide signal amplification; DAPI, 4′,6-diamidino-2-phenylindole.

