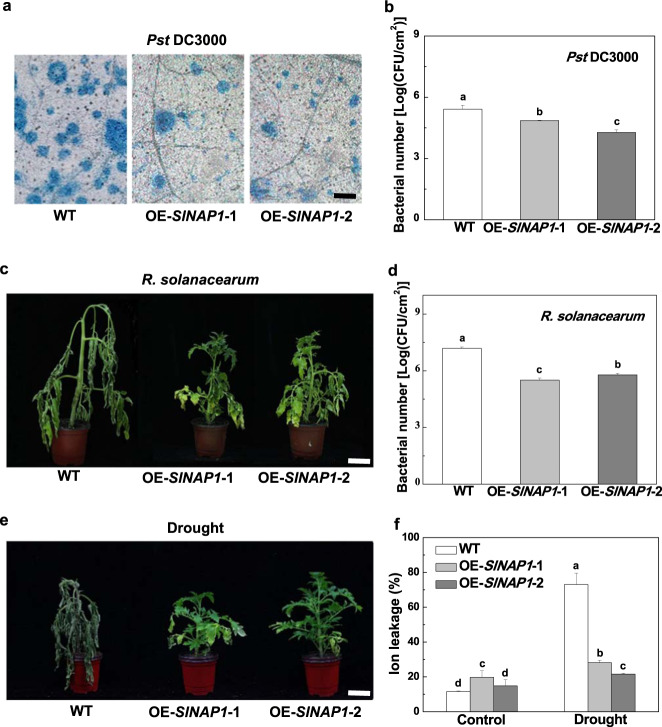
Fig. 3. Effects of SlNAP1 overexpression on tomato disease resistance and drought tolerance.
a Trypan blue staining for cell death in tomato leaves sampled at 2 dpi with Pst DC3000. Bar = 500 µm. b Pst DC3000 bacterial population at 2 dpi. c Phenotypes of plants at 12 dpi with R. solanacearum. Bar = 5 cm. d R. solanacearum bacterial population at 12 dpi. e Phenotypes of plants after the imposition of drought for 7 days. Bar = 5 cm. f Ion leakage of plant leaves under drought for 7 days. The results represent the averages ± SDs, n = 3. The different letters indicate significant differences between treatments (P < 0.05, Tukey’s test). The experiments described above were performed three times, each yielding similar results

