
Figure 3. Relationship between normalized mean thalamic volume and MRI metrics at 7 Tesla and 3 Tesla.
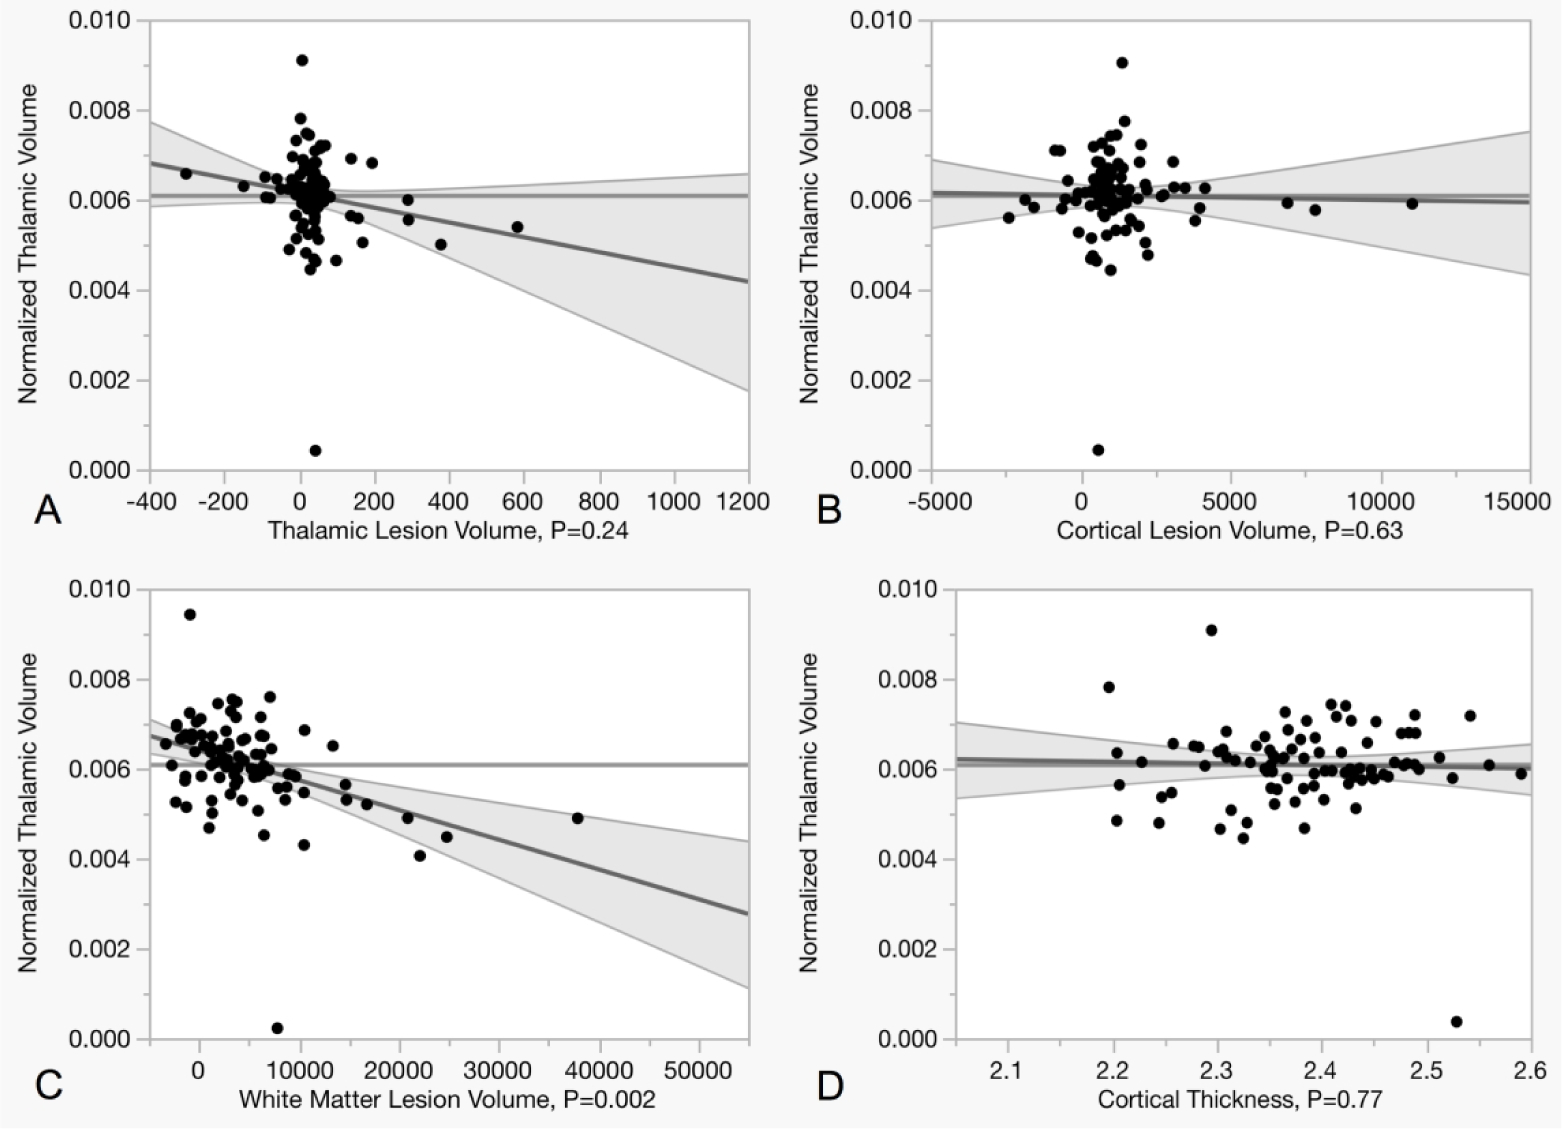
Scatter plots summarizing the relationship between thalamic volume and thalamic (A), cortical (B), and white matter (C) lesion load at 7T as well as with cortical thickness (D). The multivariate regression shows how thalamic volume correlates with white matter lesion load, but not with cortical thickness and thalamic or cortical lesion load.