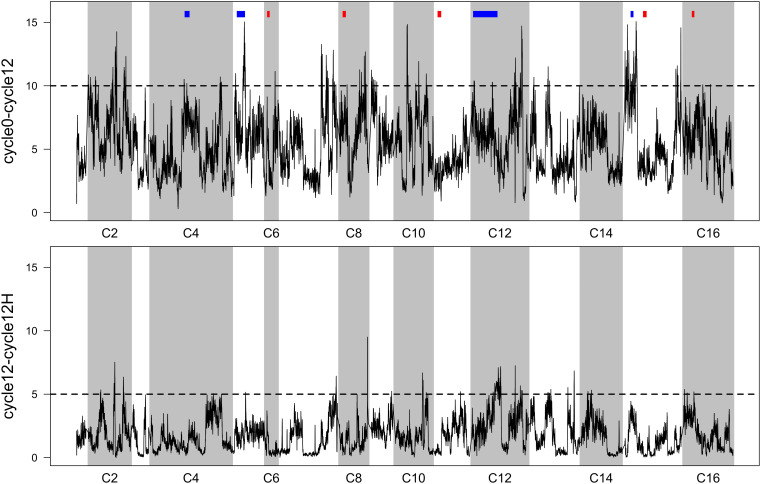
FIGURE 3.
Sliding-window FET scores (p-values have been -log10 transformed). Top: per-SNP p-values comparing allele frequencies in the 4X population initially, vs. after 12 cycles of RSA and outcrossing. Previously reported QTL (9 regions from Cubillos et al., 2013) for outcrossing are shown in blocks above the peaks—blue indicates a significant overlap and red indicates no overlap. Bottom: per-SNP p-values comparing allele frequencies in the 4X population after 12 cycles of RSA and outcrossing, with and without a final heat-shock step. In both panels, regions that exceed the dotted line can be considered significantly differentiated (threshold derivations are described in Supplementary Figure S2).

