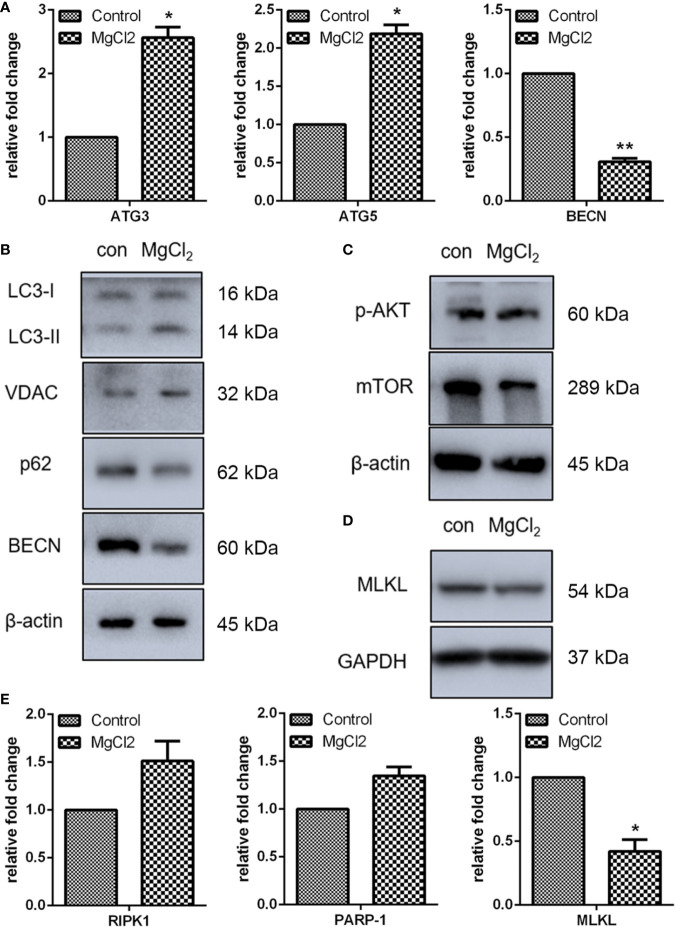
Figure 3.
MgCl2 affected autophagy and necroptosis in UC3 cells. (A) mRNA expression of autophagy-associated genes as revealed by qRT-PCR. (B) Protein expression of autophagy marker genes as determined by Western blot analysis. (C) Evaluation of Akt phosphorylation (p-Akt) and mTOR as determined by Western blot analysis. (D) Expression of MLKL as determined by Western blot analysis. (E) Gene expression related to necroptosis, as revealed by qRT-PCR. The differences between the two groups were assessed using the unpaired Student’s t-test. Data were expressed as mean ± SEM of duplicate experiments. *p < 0.05 versus control, and **p < 0.01 versus control.

