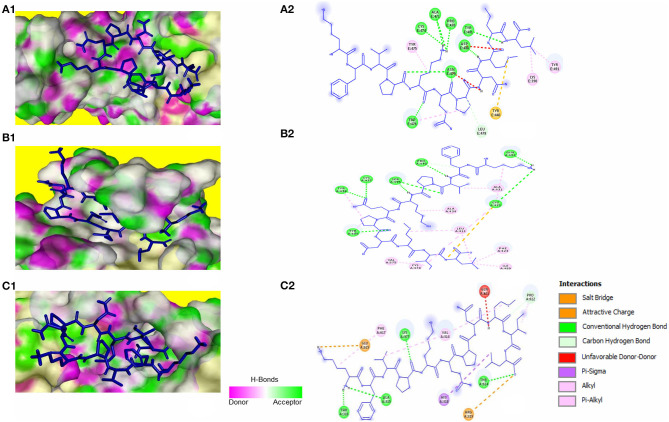
Figure 4.
KFVPKQPNMIL interaction with RBD of SARS-CoV (A), MERS-CoV (B), and HCoV-HKU1 (C). 3D illustration of complex between KFVPKQPNMIL-SARS-CoV RBD (A1), KFVPKQPNMIL-MERS-CoV RBD (B1), and KFVPKQPNMIL-HCoV-HKU1 RBD (C1). RBD surface is represented by H-bond donor and acceptor atoms. 2D representation of different bonds formed during KFVPKQPNMIL interaction with RBD of SARS-CoV (A2), MERS-CoV (B2), and HCoV-HKU1 (C2).

