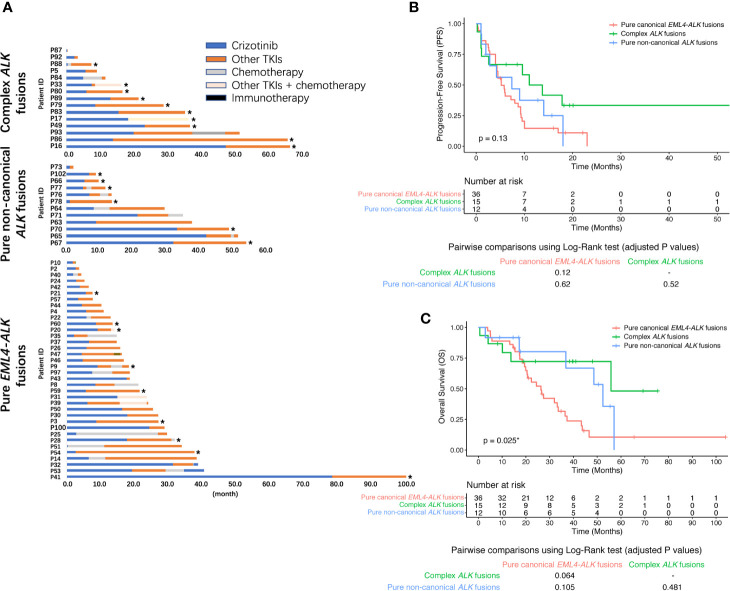
Figure 3.
Therapeutic response to next-generation ALK TKIs in post-crizotinib patients. (A) Swimmer plot demonstrating the post-crizotinib treatment history in 63 NSCLC patients. The asterisk represents ongoing treatment with the last follow-up on November 30, 2019. Kaplan-Meier curve of PFS (B) or OS (C) in 63 next-generation ALK TKI-treated NSCLC patients in strata of different ALK fusions. When multiple next-generation ALK TKIs were used after crizotinib, the ALK TKI that immediately followed crizotinib treatment was included for the analysis. The OS was calculated from the date of initiation of crizotinib treatment to death resulting from any causes or was censored at the last follow-up. BH-adjusted p values of the log-rank test were reported for pairwise comparisons.

