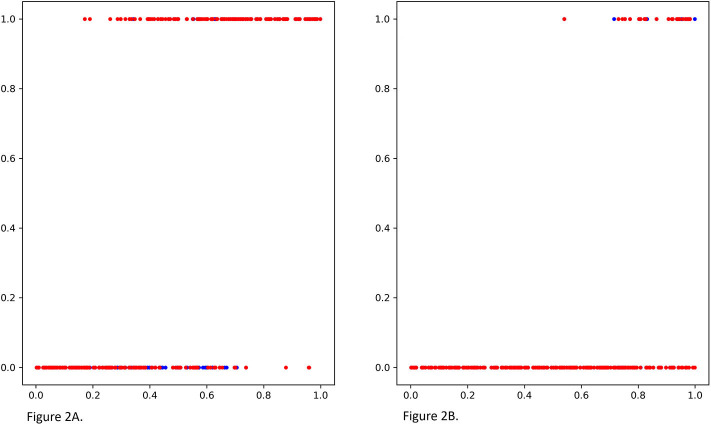
Figure 2.
(A) The true potential outcomes with treatment Y1 and estimated potential outcomes ŷ1 using MGANITE, where the x axis denoted a value of covariate X1, the y axis denoted the potential outcome, a blue color dot represented the true outcome Y1 and a red color dot represented the estimated outcomes ŷ1. (B) The true potential outcomes without treatment Y0and estimated potential outcomes ŷ0 using MGANITE, where the x axis denoted a value of covariate X1, the y axis denoted the potential outcome, a blue color dot represented the true outcome Y0 and a red color dot represented the estimated outcomes ŷ0.

