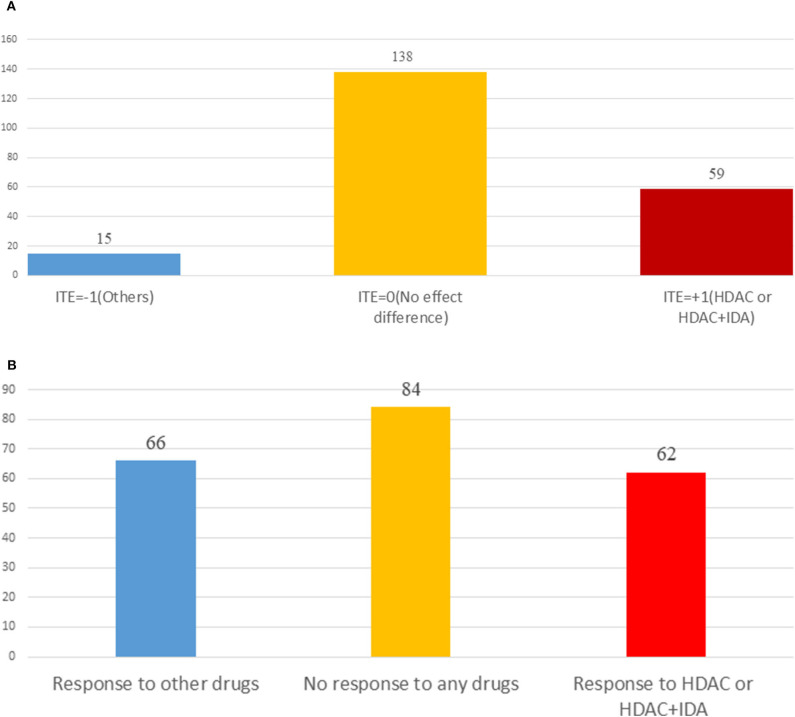
Figure 6.
(A) Histogram of estimated drug treatment effect using MGANITE, where the x axis denoted the value of ITE and the y axis denoted the number of patients, ITE = +1 denoted the ITE of patients treated with HDAC or HDAC+IDA, ITE = −1 denoted the ITE of patients treated with other drugs, and ITE = 0 denoted the ITE of two groups of patients: one group of the patients treated with HDAC or HDAC+IDA and another group of the patients treated with other drugs. (B) Histogram of observed drug treatment response where the x axis indicated three scenarios as described in (B) and the y axis denoted the number of patients, the right side in the (B) denoted the number of patients only responding to the HDAC or HDAC+IDA, the middle denoted the number of the patients that responds to both (HDAC or HDAC+IDA) and other drugs or did not respond to both (HDAC or HDAC+IDA) and other drugs, and the left side denoted the number of patients only responding to the other drugs.

