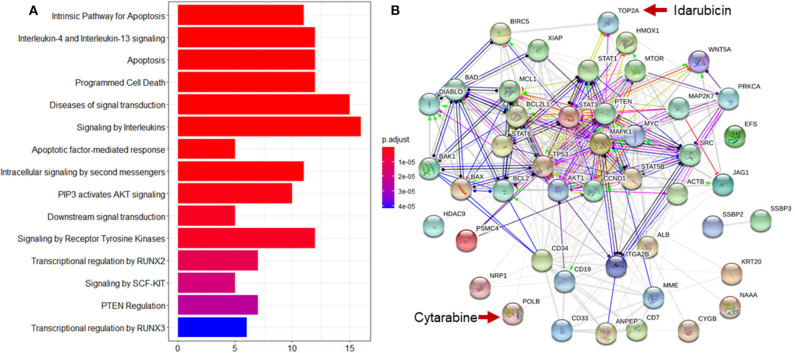
Figure 7.
Reactome pathway analysis and protein-protein interaction (PPI) network analysis to top ranking biomarkers for explanation of treatment effect variation. (A) Enrichment analysis to the top 44 ranking biomarkers for explanation of treatment effect variation with the Reactome pathway database by hypergeometric test to assess whether the number of identified biomarkers associated with the Reactome pathway was over-represented more than expected. The original P-value from the hypergeometric test was then adjusted by FDR for multiple test correction. The top 15 most significantly enriched pathways was shown. (B) PPI network analysis was performed by String 11.0 to show the protein-protein interaction among top ranking biomarkers. We found that these proteins were highly interacted which was consistent with pathway enrichment analysis (PPI enrichment P-value is 1.0e-16).

