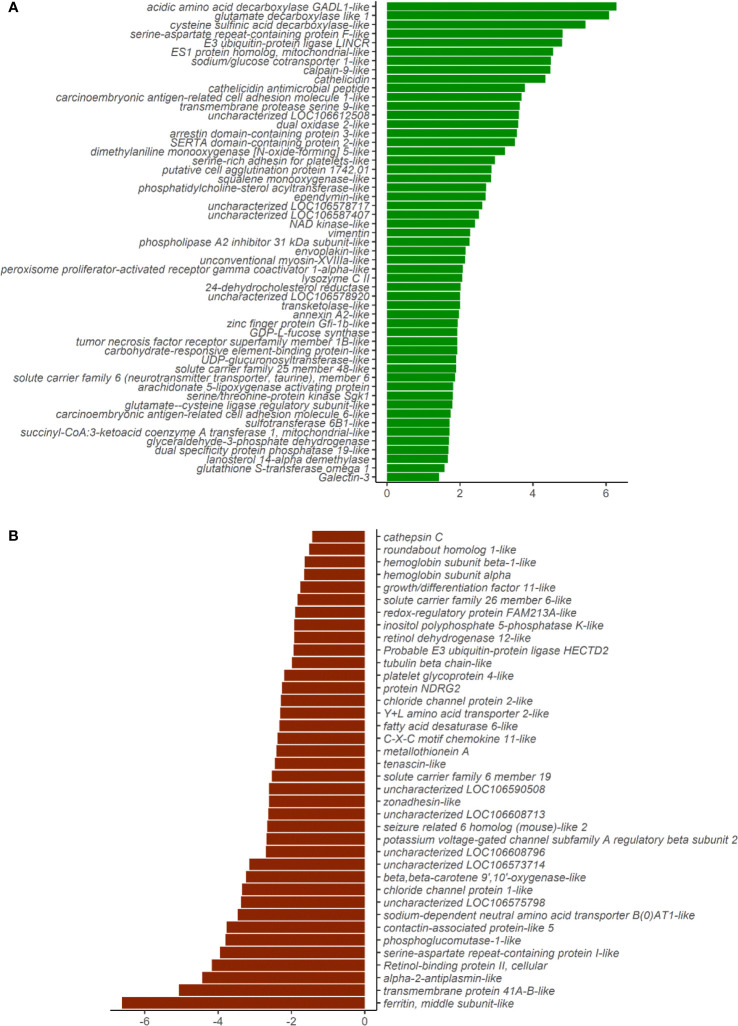
Figure 3.
Plot showing the differentially expressed genes in the distal intestine of Atlantic salmon. (A) Fifty-three genes were upregulated in the SO group (green bars). (B) Thirty-eight genes were downregulated in the SO group (red bars). X-axis labels show the log2foldchange, and the y-axis shows the differentially expressed genes.

