
Figure 4:
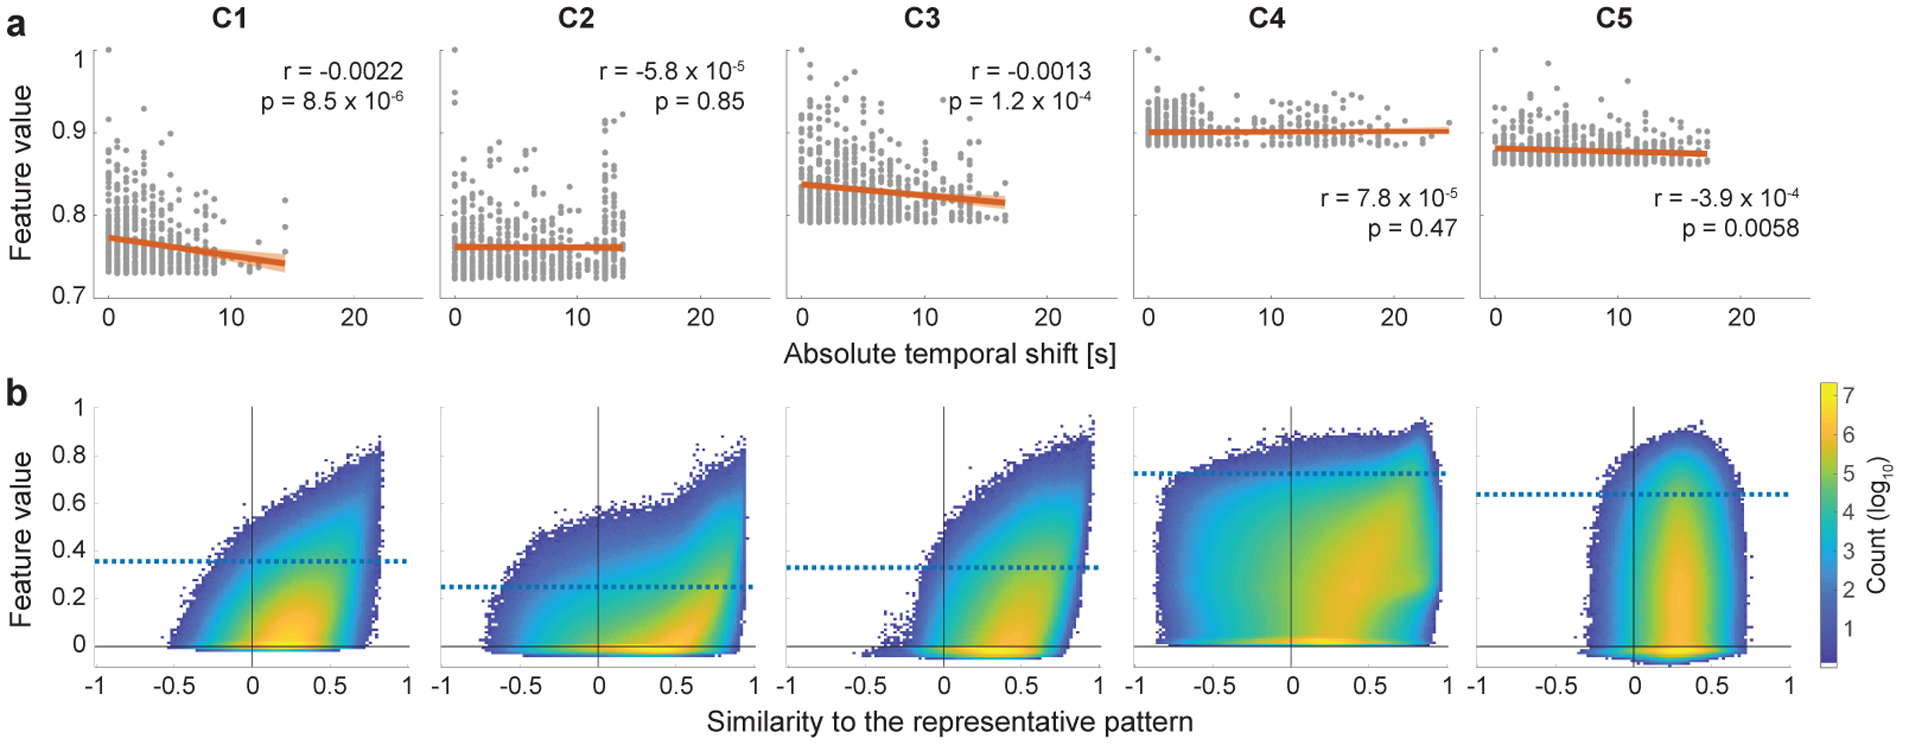
Invariance of the feature extractor against temporal modulations of the temporal primitives. (a) The robustness of the feature extractor to the temporal shifts of the realizations. Each panel shows the relationship between the feature values and the (absolute) temporal shifts that were applied to their inputs for alignment to reference signal in Fig. 2a. Each point corresponds to one of the top time series shown in Fig. 2a (n = 695). The feature values were normalized to have maximum value of 1 for each component. The red lines are the estimated least-square fits, and colored bands indicate 95% confidence bounds. Although the slopes are significant in some of the components, they are quite small, which illustrates the shift-invariance of the feature extractor. (b) Two-dimensional histogram showing the relationship between feature values and the similarities of their inputs to the representation patterns (Fig. 2a). To evaluate only the modulations different from the temporal shifts shown in a, the similarities (Pearson correlation) were measured after compensating their temporal shifts relative to the representative patterns (see Section 2.8 for the temporal-shift alignment). Blue horizontal lines are the chance levels same with those shown in Fig. 3a. Note that the colorbar is log-scale.