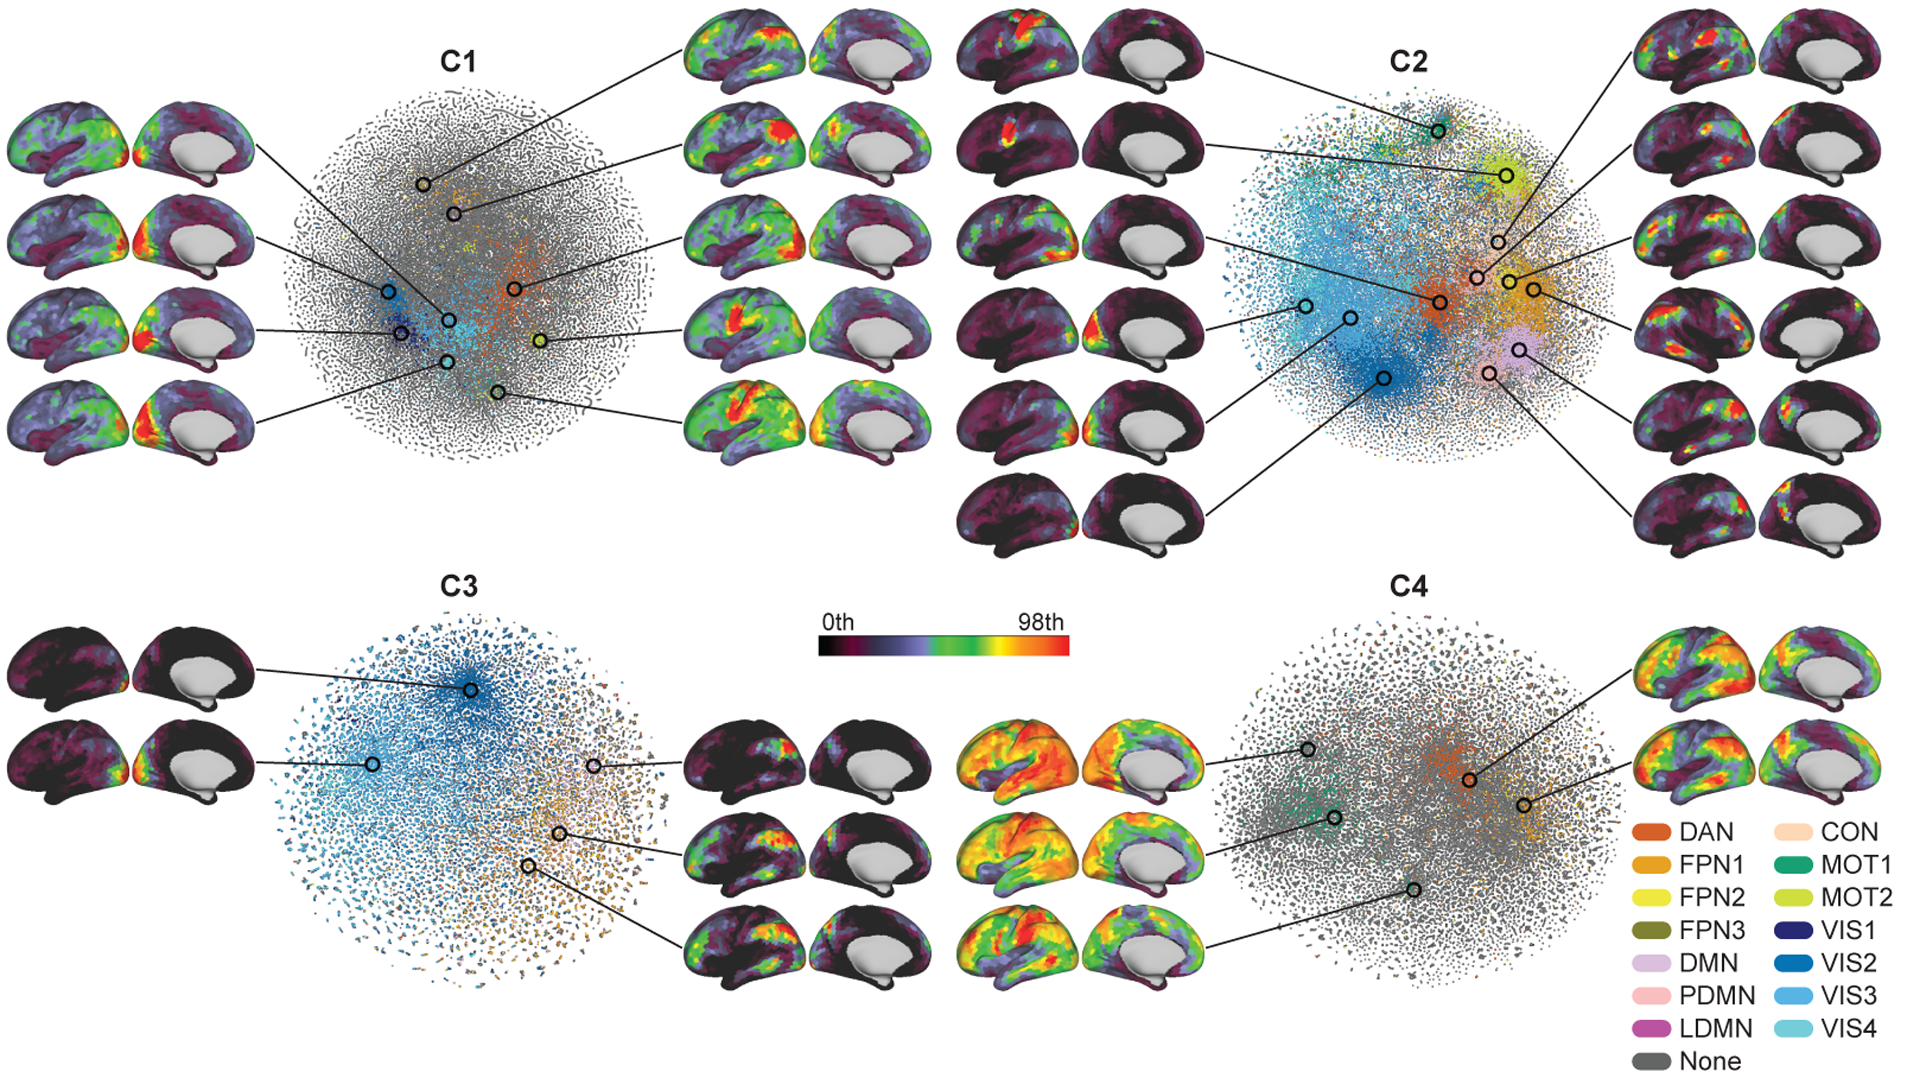
Figure 6:

The spontaneous spatial co-occurrence patterns of the temporal primitives. Scatter plots show two-dimensional t-SNE embeddings of the spatial co-occurrence patterns of the temporal primitives during the resting-states (see Section 2.11 for t-SNE analysis details). The color indicates the most similar RSN obtained by conventional linear sICA (see Inline Supplementary Fig. 3); DAN (dorsal attention network), FPN (fronto-parietal network), DMN (default mode network), PDMN (posterior DMN), LDMN (lateral DMN), CON (cingulo-opercular network), MOT (motor and somatosensory network), and VIS (visual network). The similarities were measured by Pearson correlation, and thresholded by 0.35; the gray points have similarities to the RSNs less than 0.35. The spatial patterns show some examples of the co-occurrence patterns on the embedded space, obtained by taking local average of 500 data points on some locations. Only left hemispheres are shown, except for the FPN of C2 because it showed right dominant pattern.
