
Figure 9:
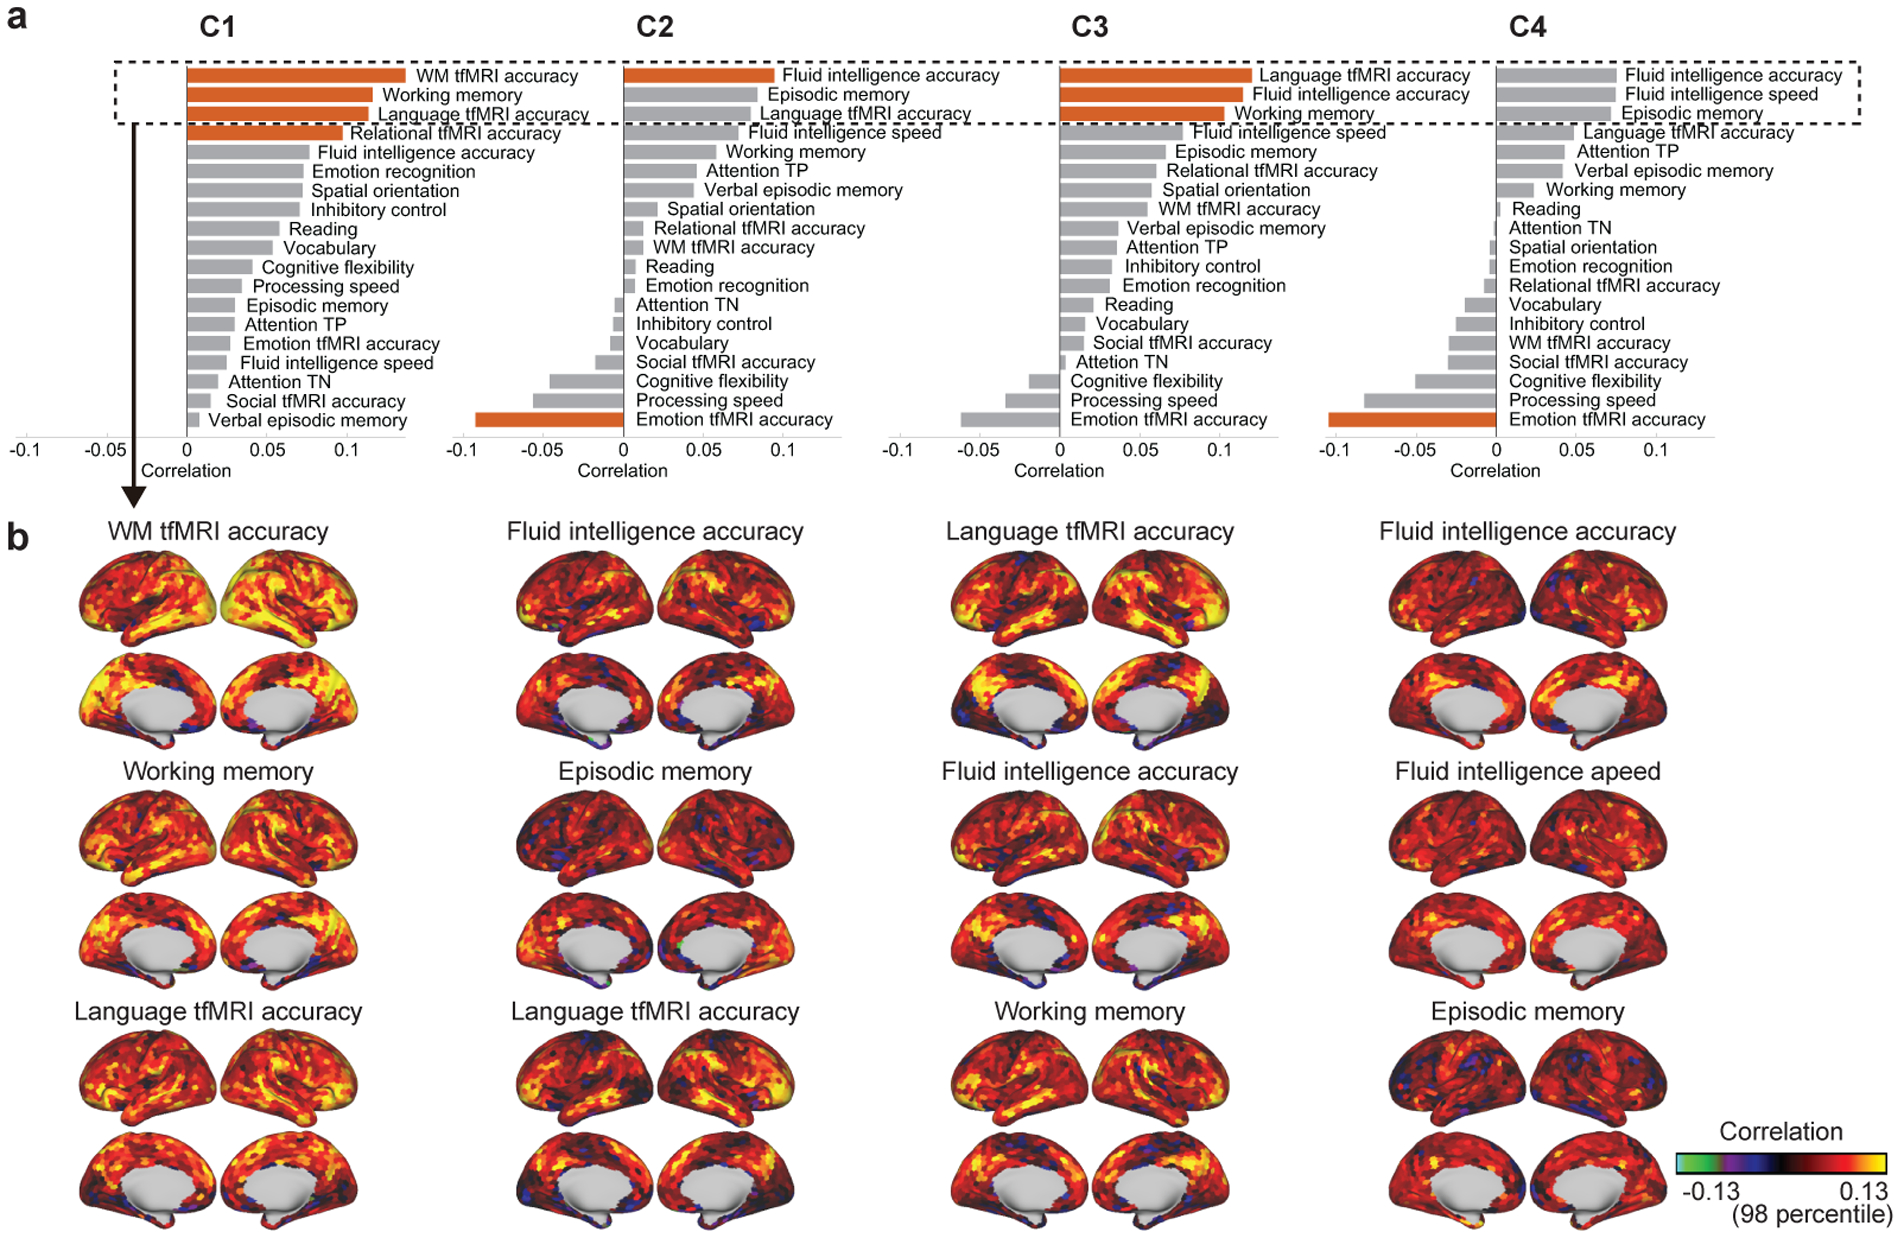
The relationship of the temporal primitives to the behavioral traits of the subjects. (a) Spearman correlation coefficient between subject-average component activities and 19 behavioral traits related to intelligence and response-accuracies during tfMRI. Red bars indicate significant relationship (p < 0.05; 100,000 times permutation test, with FDR correction for multiple comparisons). (b) The spatial distribution of the relationship between subject-parcel-average component activities and some traits corresponding to the top-3 highest correlation in a for each component (column).