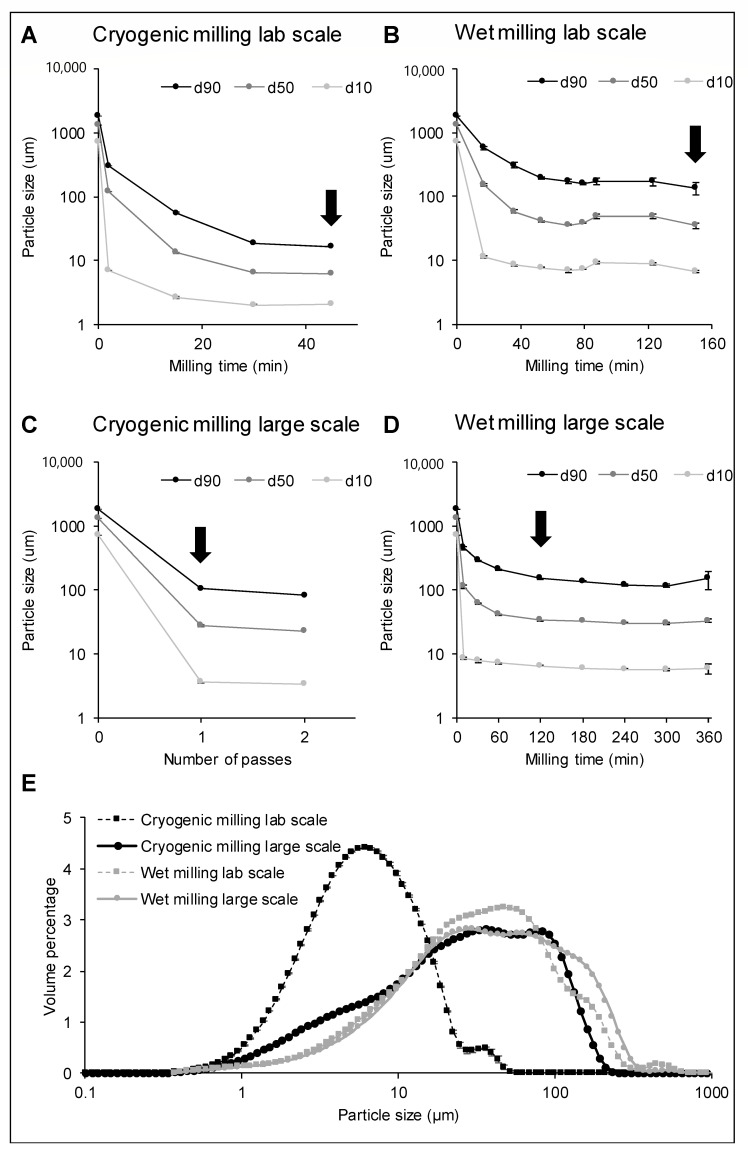
Figure 2.
The particle size distribution of wheat bran as a function of time or number of passes during (A) cryogenic milling on a laboratory scale, (B) wet milling on a laboratory scale, (C) cryogenic milling on a large scale, (D) wet milling on a large scale. d10, d50 and d90 correspond to the diameter where 10, 50 or 90% of the distribution has a smaller particle size. The samples that were further characterised are indicated with arrows in (A–D), and their particle size distribution in percentage by volume is shown in (E).

