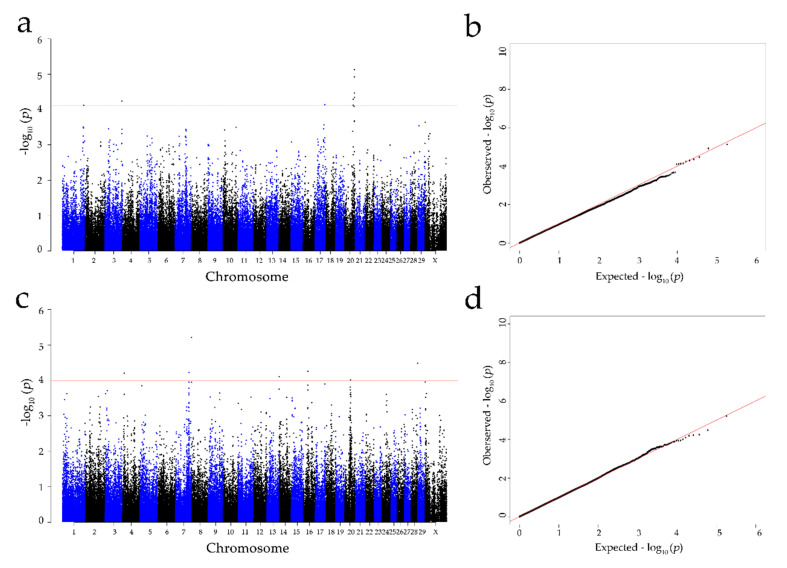
Figure 3.
Manhattan and Q-Q plots of the observed p-values for the concentration of albumin in the colostrum and serum: (a,b) indicate the albumin concentration in colostrum; (c,d) indicate the albumin concentration in serum. The Manhattan plots present the −log10 values (p-values) for the genome-wide SNPs (y-axis) plotted against their respective positions on each chromosome (x-axis); the horizontal red in the Manhattan plots present the thresholds with an FDR rate of 1% for albumin in colostrum (7.85 × 10⁵) and serum (1.01 × 10⁵). The Q-Q plots show the observed −log10-transformed p-values (y-axis) and the expected −log10-transformed p-values (x-axis).

