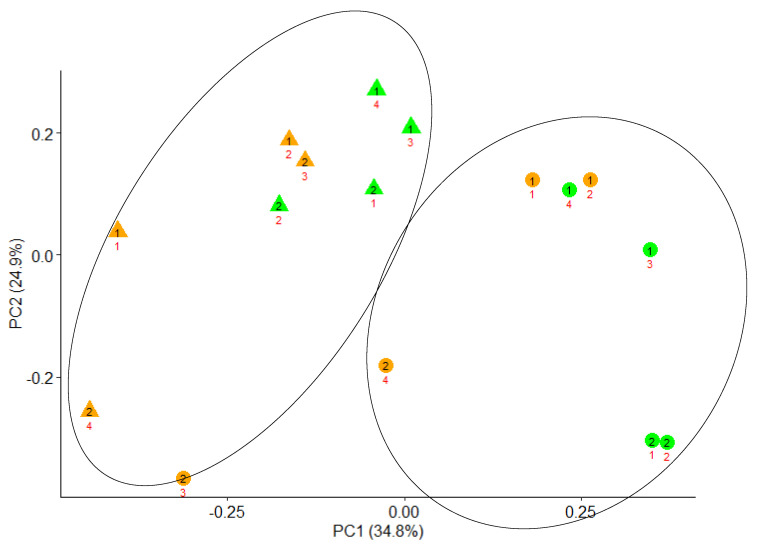
Figure 1.
Principal coordinate analysis (PCoA) plot (Bray–Curtis dissimilarities) of the automated ribosomal intergenic spacer analysis (ARISA) profiles from digesta of Rusitec fermenters fed either a mixed diet (orange) or a diet containing crude olive cake (green) replacing 33% of the forage. Circles and triangles correspond to liquid and solid digesta, respectively. Numbers in black (1 and 2) relate to incubation run, and those in red (1 to 4) to a Rusitec fermenter.

