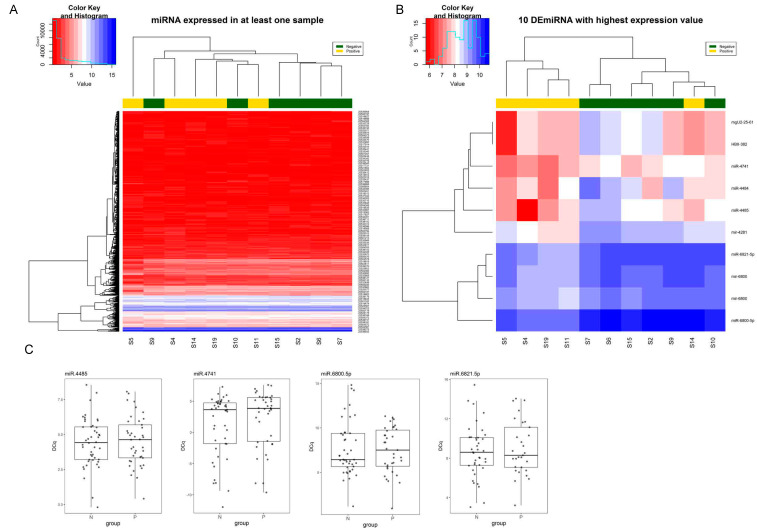
Figure 2.
Results of miRNA expression profile by microarrays. (A) Heatmap showing the expression (microarray intensity signal) of miRNA that are expressed in at least one sample. (B) Heatmap of the expression of the ten DEmiRNAs showing the highest expression. Hierarchical clustering shows that the expression pattern of these ten miRNAs is able to group patients according to their LS-OCMBs status. (C) RT-qPCR validation results of selected candidate miRNAs. P—positive LS-OCMB status. N—negative LS-OCMB status. DE—differentially expressed.

