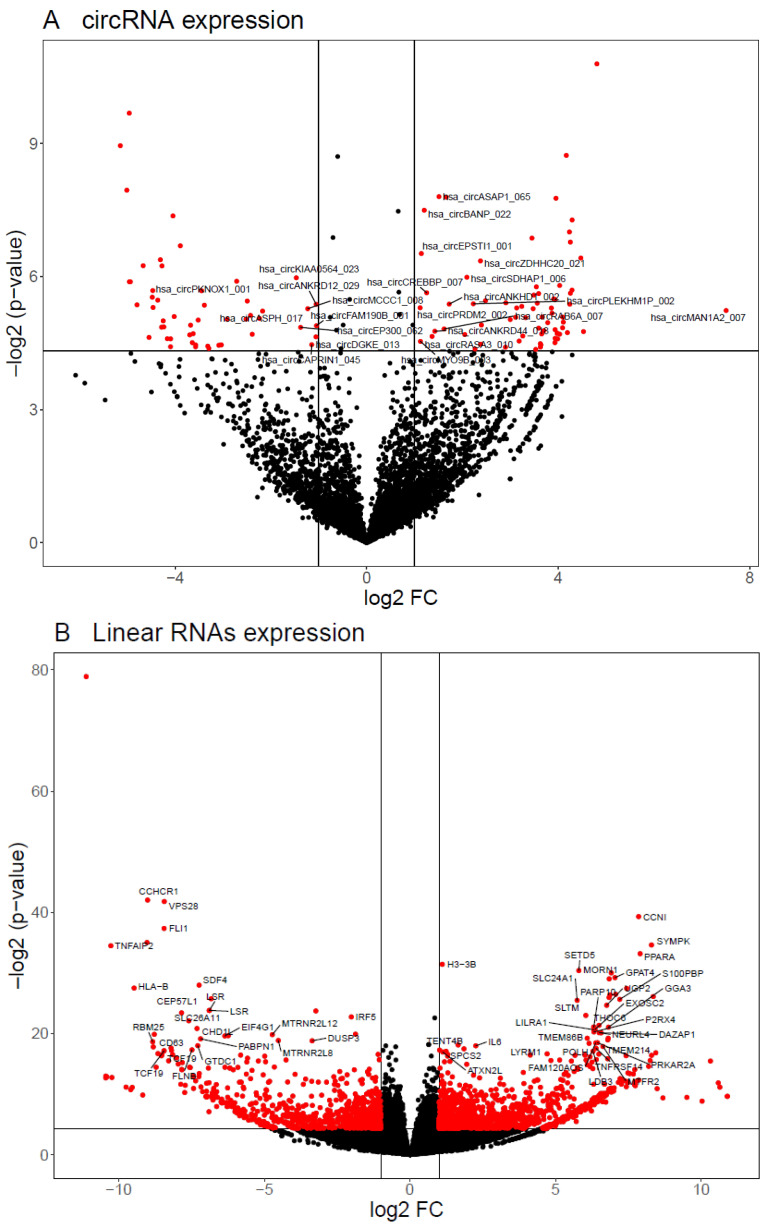
Figure 3.
Results of circRNAs and linear RNAs expression profile by RNA-seq. (A) Volcano plot showing the expression difference (log2 FC) between positive and negative group of circRNA that show a sum of reads across all samples higher than 10. DEcircRNA are highlighted in red and labels point at those DEcircRNA with a base mean higher than 5. (B) Volcano plot showing the expression difference (log2 FC) of linear RNAs between positive and negative groups. Differentially expressed linear RNAs are highlighted in red and labels point at those DE linear RNAs with an adjusted p-value < 0.01. (C) RT-qPCR validation results of selected candidate circRNAs. Asterisk indicates a statistically significant difference (p < 0.01). circ_0000478 and circ_0116639 validation includes more samples than the rest of the circRNAs because of limitations in sample amount (Table S1). (D) RT-qPCR validation results of selected candidate linear RNAs. Asterisk indicates a statistically significant difference (p < 0.05). P: positive LS-OCMB status. N: negative LS-OCMB status.


