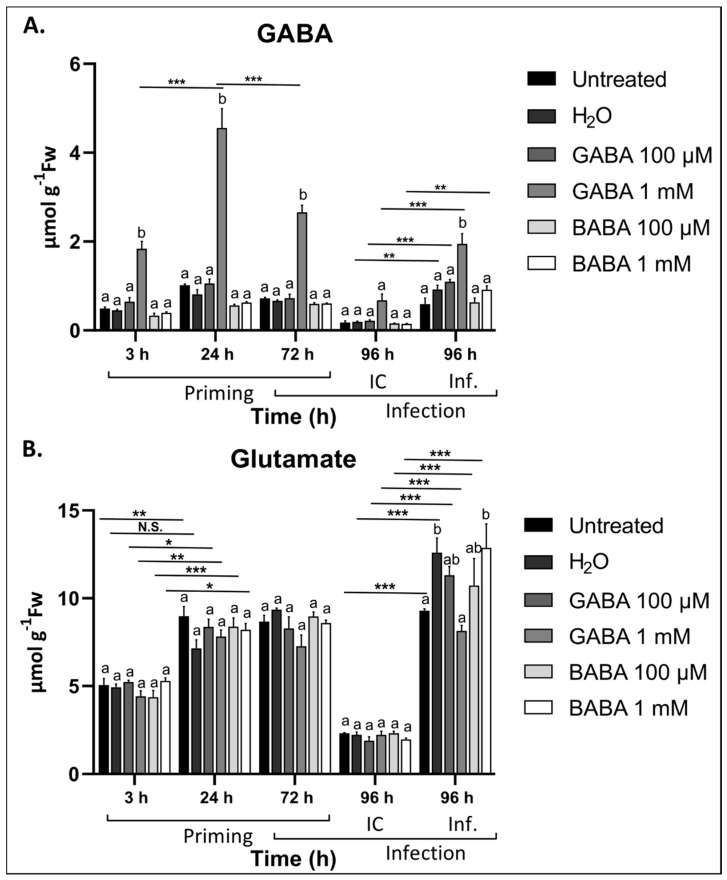
Figure 4.
Changes in the total leaf GABA and Glu content in Arabidopsis after exogenous GABA treatment and infection with B. cinerea. Levels of (A) GABA and (B) Glu in Arabidopsis leaves after treatment with either 100 µM or 1 mM GABA followed by B. cinerea infection compared to untreated and H2O controls. Bars are the mean ± SE of 3 biological replicates. Significance is indicated by different letters (a and b) (p < 0.05) within the same timepoint, and with an asterisk between timepoints according to two-way ANOVA and Tukey’s multiple comparison test and adjusted p values (not significant, N.S.; * p < 0.05; ** p < 0.01; *** p < 0.001). IC: infection control. Inf: Infection.

