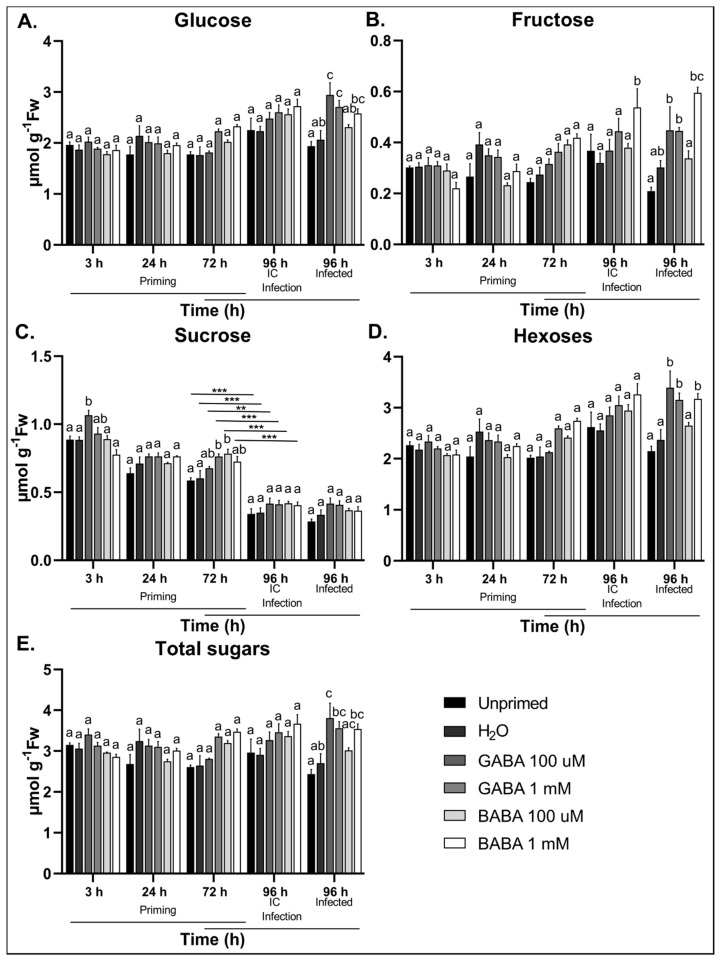
Figure 6.
Analysis of soluble sugar content after treatment with GABA or BABA followed by infection with B. cinerea. (A) Glucose, (B) fructose, and (C) sucrose levels in response to GABA and BABA treatment at 100 µM and 1 mM followed by B. cinerea infection. (D) Total hexoses (glucose + fructose) and (E) total sugars (glucose + fructose + sucrose). Bars are the mean ± SE of 6 biological repeats. Statistical significance is indicated by different letters (a, b and c) within the same timepoint (p < 0.05) and with an asterisk between different timepoints (** p < 0.01; *** p < 0.001) based on two-way ANOVA followed by Tukey’s multiple comparison test and adjusted p values. Data is representative of one experiment from 3 independent repeats with consistent results.

