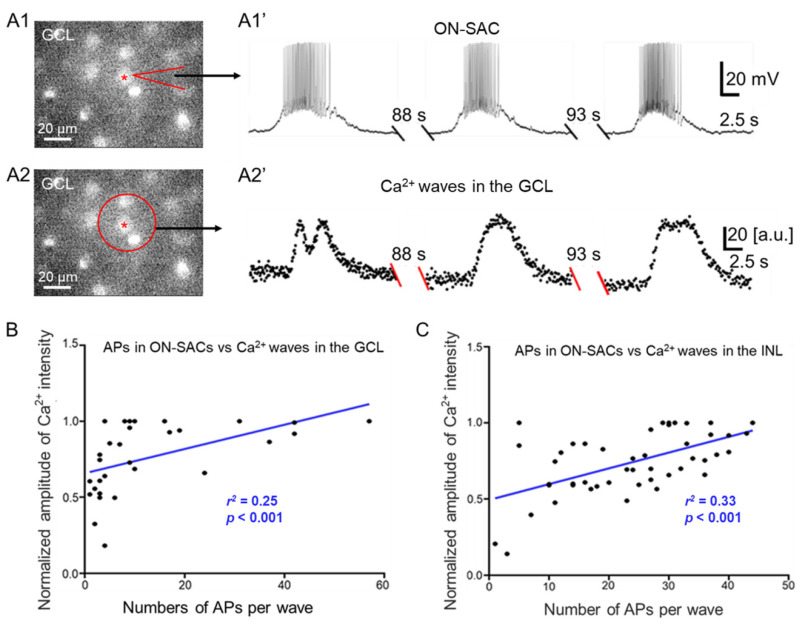
Figure 6.
The APs of ON-SACs influencing the Ca2+ intensities of the GCL and INL during cholinergic waves. (A) Simultaneous Ca2+ imaging and whole-cell current-clamp recordings were performed in the GCL of retinas isolated from ChAT-Cre/Ai95D mice at P4–P5. A live image in A1 shows GCaMP6f-labeled ON-SACs at P5. One of the ON-SACs (indicated by a red star) was patched with a glass pipette (indicated by an arrow). The cell exhibited spontaneous rhythmic depolarization accompanied by APs (A1′). Ca2+ images in the GCL were taken simultaneously with the ON-SAC recording. An ROI (a red circle in A2) was selected to construct a Ca2+ wave trace. The trace demonstrates that each Ca2+ transient was preceded by an electrical wave from the ON-SAC (A2′). In A1′ and A2′, the recording trace between each wave was not shown (double slashes) for a period of time (indicated above the double-slashes). (B) The relationship was plotted (black dots) between the normalized peak amplitude of a Ca2+ wave in the GCL and the number of APs in the corresponding ON-SAC electrical wave. The scatterplot data were fit with the linear regression (blue line, r2 = 0.25, p < 0.001). (C) Ca2+ imaging in the INL was simultaneously performed alongside whole-cell current-clamp recordings of ON-SACs in the GCL in retinas from ChAT-Cre/Ai95D mice at P4–P5. The normalized peak amplitude of a Ca2+ wave in the INL was plotted as a function of the number of APs of the corresponding ON-SAC electrical wave (black dots). The group data were fit with the linear regression (blue line, r2 = 0.33, p < 0.001).

