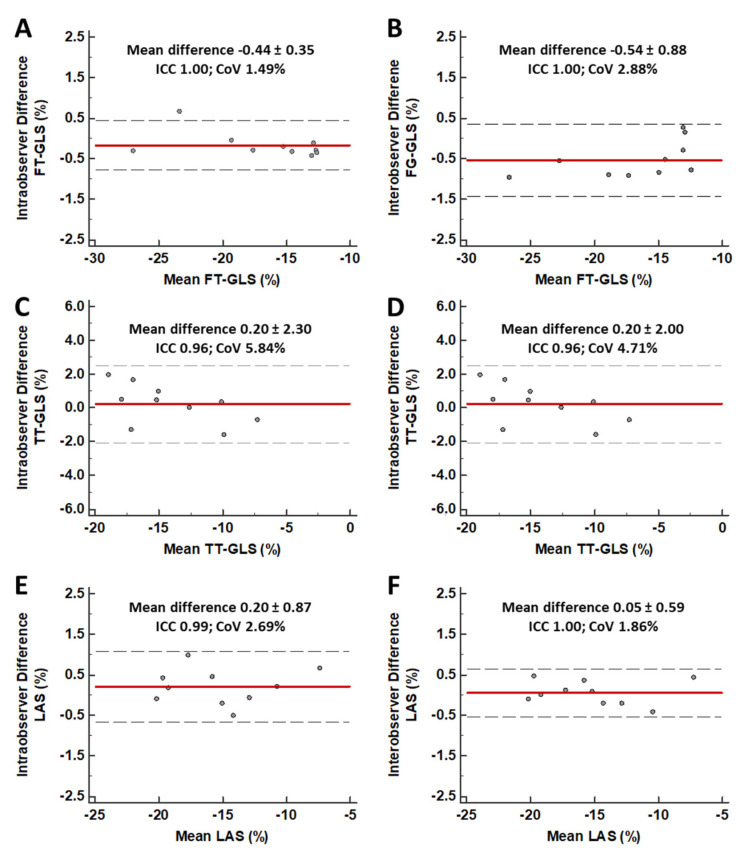
Figure 2.
Intra- and Inter-observer variability of different approaches for strain assessment. Bland–Altman analysis showing low intra- and inter-observer variability for FT-GLS (Panels A and B), TT-GLS (Panels C and D), and fast manual LAS (Panes E and F). Red line = mean absolute difference; Black, dotted lines = 95% confidence interval. CoV = Coefficient of variation; FT = feature tracking; GLS = global longitudinal strain; ICC = Intraclass correlation coefficient; LAS = long-axis strain; TT = tissue tracking.

