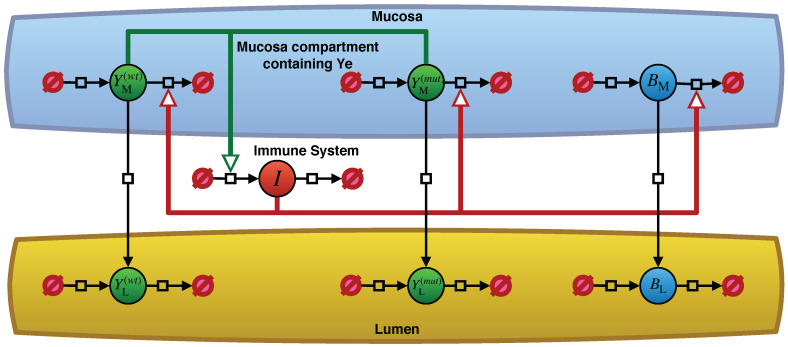
Figure 1.
An overview of the Yersinia enterocolitica population dynamics model. Filled circles represent the entity pool nodes for the populations of Ye in their respective compartments as well as the strength of the immune reaction I. Table 1 explains the notations used in the model and this figure. The black arrows represent processes with an impact on the population dynamics of the entity pools. Arrows pointing from empty set symbols to pool nodes denote an increase in the population size or a decrease if the process arcs point from entity pools to empty sets. Migration across compartments of the respective populations appears as vertical process arcs. Some of these processes receive stimulating effects from the immune reaction or from the size of the Ye populations within the mucosa, as colored arcs indicate. Reference [10] provides a more detailed description of the model’s structure.

