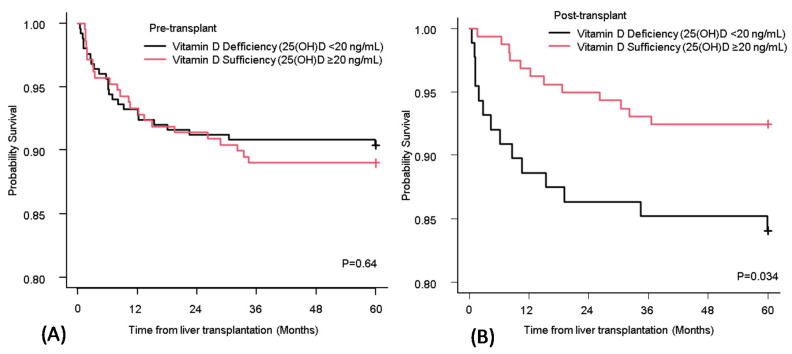
Figure 2.
OS of recipients who had vitamin D deficiency and sufficiency at pre-transplant (A) and post-transplant (B). The Kaplan–Meier curve for OS of recipients who had vitamin D deficiency (black line) and sufficiency (red line). Vitamin D deficiency was defined as <20 ng/mL of the serum level of 25(OH)D. OS: overall survival; 25(OH)D: 25-hydroxy vitamin D.

