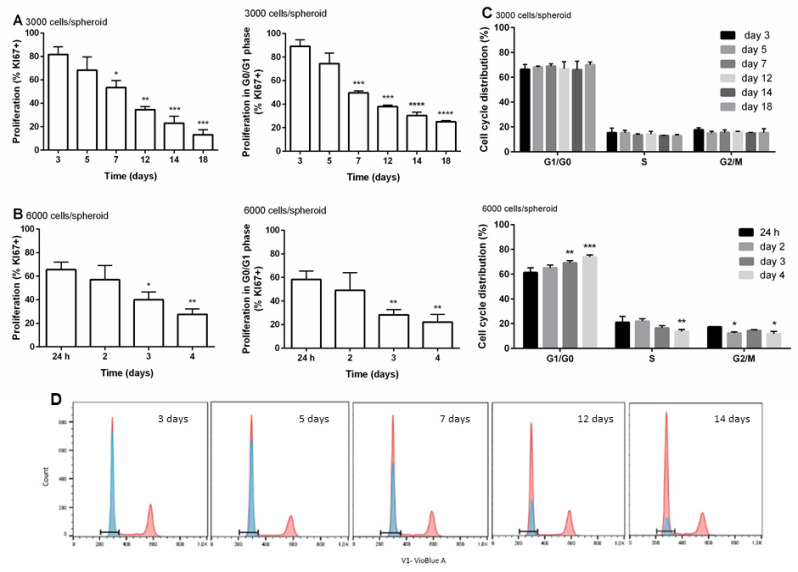
Figure 2.
The proliferation of cells and the distribution of cells in different phases of the cell cycle during the time of cultivation. Percentage of KI67-positive cells and the percentage of KI67-positive cells within the G0/G1 phase of cell cycle overtime at density 6000 cells/spheroid (A). Percentage of KI67-positive cells and the percentage of KI67-positive cells within the G0/G1 phase of cell cycle overtime at density 3000 cells/spheroid (B). Distribution of cells in different phases of the cell cycle over the period of cultivation (C). Representative overlays of simultaneous staining with Hoechst for the cell cycle (red) and anti-KI67 antibody (blue) (D). The results are presented as the mean ± SD (N = 3). The statistical analysis was conducted in GraphPad Prism 6, by the two-way ANOVA using the Bonferroni multiple comparisons test, * p < 0.05, ** p < 0.01, *** p < 0.001, **** p < 0.0001.

