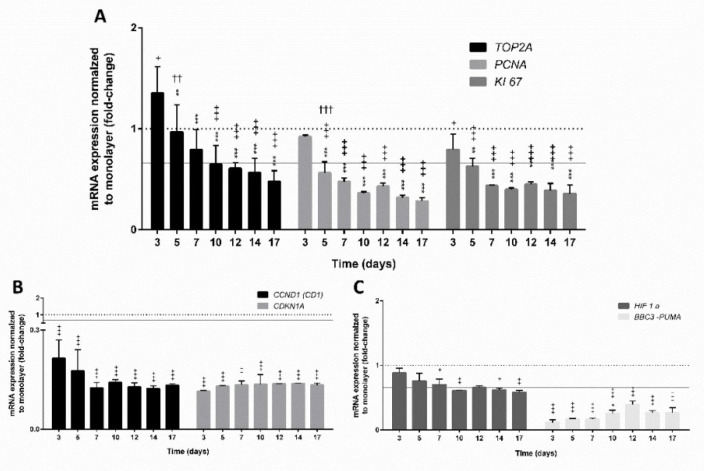
Figure 3.
Relative expression of genes involved in the proliferation process (A,B) and apoptosis (C) over time from 3 to 17 days. The significant difference between (i) the monolayer culture (2D) and the spheroids (3D) ( + p < 0.05, ++ p < 0.01, +++ p < 0.001); (ii) the first day (at day 3) of measurement and all subsequent days (* p < 0.05, ** p < 0.01, *** p < 0.001); and (iii) within days (†† p < 0.01, ††† p < 0.001) was calculated in GraphPad Prism 6, by two-way ANOVA considering Dunnett’s multiple comparisons test. Results are presented as the mean ± SD (N = 3). The dotted line denotes the expression of the corresponding gene in monolayer culture (1-fold change), the grey line indicates up- or downregulation of genes with the threshold set at 1.5-fold, which is more than 1.5 or less than 0.66 relative expression, respectively.

