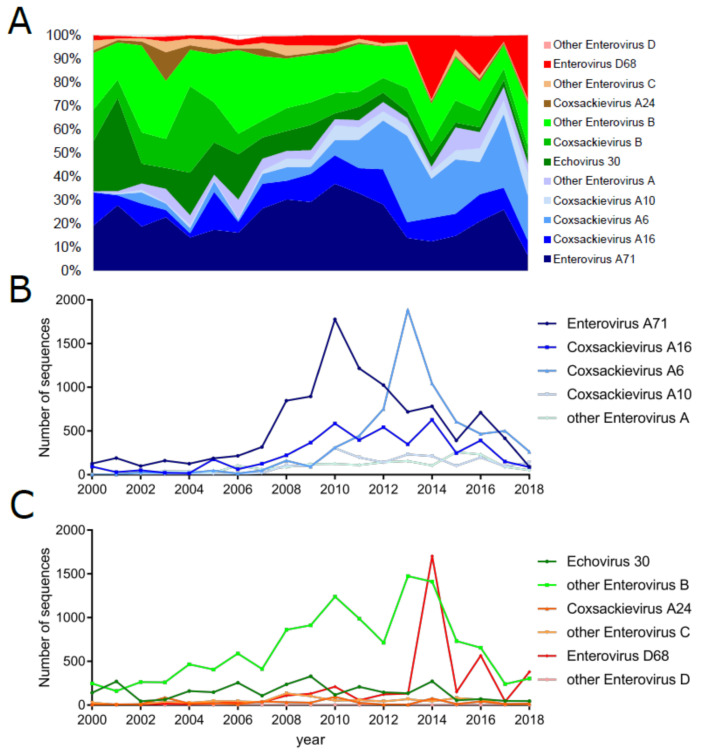
Figure 4.
Enterovirus sequence representation from 2000 to 2018 by type. The sample collection calendar year (if available) of all non-polio enteroviruses A (blue), B (green), C (brown), and D (red) sequences. The percentage of each type collected during each year is given in panel (A). The numbers of sequences collected from the most common types of EV-A and EV-B, -C, and -D are displayed in panels (B) and (C), respectively. Data were obtained using the ViPR database, as described in Table 1 footnotes.

