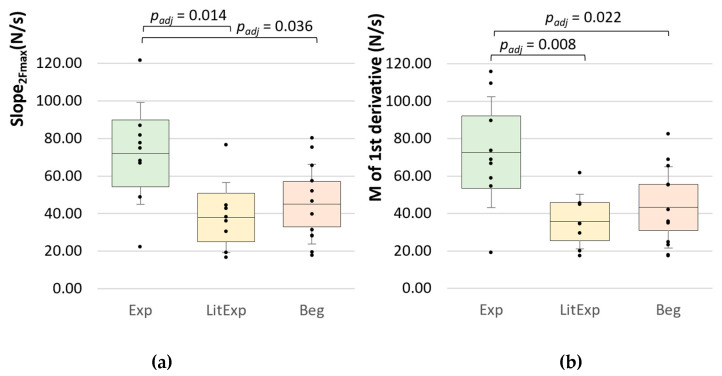
Figure 10.
Inter-group comparisons of the overall slope parameters. Displayed are the Ms, SDs (error bars) and 95%-CIs of (a) the averaged slope from start to Fmax (Slope_2max) (N/s) and (b) the averaged 1st derivative of the 10 force profiles (N/s) comparing the groups Exp (green), LitExp (yellow) and Beg (orange). Significant comparisons are marked with padj-values.

