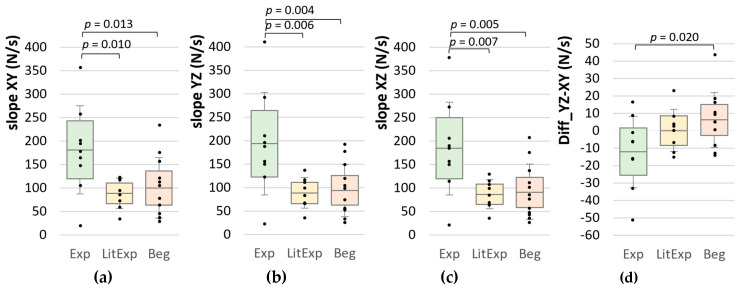
Figure 11.
Slope parameters in the linear section XYZ. Displayed are the Ms, SDs (error bars) and 95%-CIs of the slope in the linear part of (a) between XY, (b) between YZ, (c) between XZ and (d) the difference between YZ and XY comparing the groups Exp (green), LitExp (yellow) and Beg (orange). The significant pairwise comparisons are marked with p-values (not adjusted).

