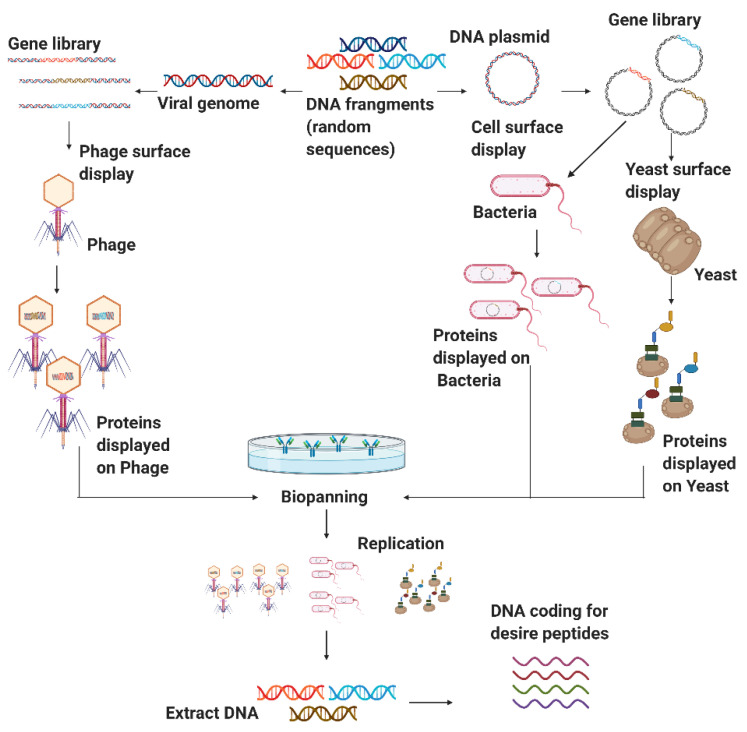
Figure 4.
Scheme of the different microbial cell surface display methods. The phage display method is shown on the left, while the bacterial display process is presented in the center, and the yeast display is presented on the right. In all cases, through molecular biology tools it is possible to express the protein fragments of interest quite robustly for further biomolecular interaction analysis and screening (Created with BioRender).

