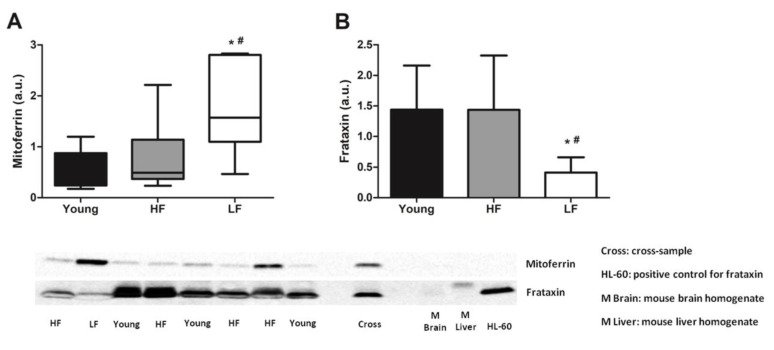
Figure 1.
Protein levels of mitoferrin and frataxin in the vastus lateralis muscle of young and old participants. (A) Comparisons of mitoferrin levels by Kruskal–Wallis H statistics and of (B) frataxin by one-way ANOVA among young participants (n = 11) and high- (HF, n = 16) and low-functioning (LF, n = 7) older adults. In (A) box plots represent median values (interquartile ranges), while in (B) bars represent mean values (±standard deviation) for the three experimental groups. Values are expressed in arbitrary units (a.u.) and representative blots are shown for each protein. * p < 0.05 vs. young group; # p < 0.05 vs. HF group.

