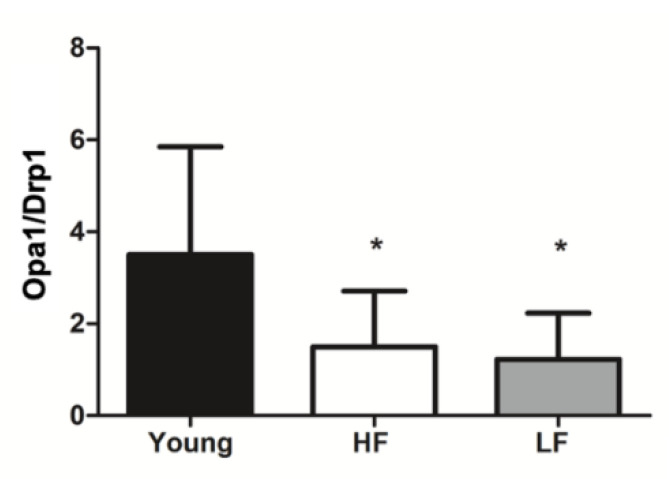
Figure 3.
Mitochondrial fusion index in the vastus lateralis muscle of young and old participants. The fusion index was calculated as the ratio between protein levels of the fusion marker optic atrophy 1 (Opa1) and those of the fission factor dynamin-related protein 1 (Drp1). Differences among groups were assessed by one-way ANOVA. Bars represent mean values (±standard deviation) for the three experimental groups. * p < 0.05 vs. young group (n = 11); HF: high-functioning (n = 16); LF: low-functioning (n = 7).

