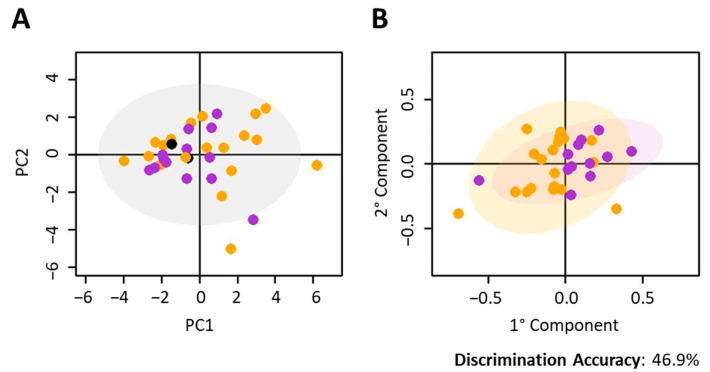
Figure 1.
Nivolumab-treated cohort. Discrimination between the metabolomic profiles of baseline serum samples (T0) from different histology of NSCLC. Score plots of (A) PCA analysis of all samples; (B) O-PLS analysis of samples with squamous carcinoma and adenocarcinoma. In each score plot, each dot represents a different serum sample. Orange dots: adenocarcinoma; green dots: squamous cell carcinoma; black dots: NOS histology.

